


Unleash the list of potential ManageEngine OpManager alternatives. Pick the best ManageEngine OpManager Competitors to manage your network and server monitoring needs effortlessly:
ManageEngine OpManager is an all-around IT infrastructure manager that helps monitor, manage, and secure a system with various expert solutions. It offers a deep view of all your network and servers, including your routers, switches, firewalls, load balancers, and so on.
With this comprehensive approach, OpManager provides an optimal network monitoring system that enables organizations to monitor and manage multiple remote sites.
Table of Contents:
ManageEngine OpManager: Top Substitutes
It also offers an integrated network monitoring system called ManageEngine OpManager Plus. It includes network monitoring, configuration management, switch port management, firewall log management, IP address management, and bandwidth monitoring in one integrated platform.
Its network monitoring strategies apply to industries such as automotive, aviation, finance, defense, education, government, healthcare, media, and more.
Its pricing plans are fairly low compared to other alternatives. It also provides a free edition for small enterprises that need to monitor only up to 3 devices. The package includes network monitoring, server monitoring, visualization monitoring, alerts and alarms, and NOC view dashboards.
ManageEngine OpManager is a powerful network and server monitoring software with rich features for effortless network monitoring.
It has been recognized in many reputed review sites, including Capterra, Software Advice, GetApp, Gartner Peer Insights, etc., and has been awarded in many categories, such as Leaders 2024 for Network Monitoring, Most Recommended 2024 in the category Data Center Management, and so on.
Support: Email, phone, live chat, forum, knowledge base, video tutorials, webinars, and on-demand premium support with paid version.
Features of ManageEngine OpManager:
- Full Visibility into the Network: It helps provide full visibility of routers, switches, firewalls, load balancers, etc. to monitor and manage them effectively.
- Server Management: It helps monitor physical and virtual servers across multiple vendors’ operating systems, including real-time server performance monitoring, server availability, server health monitoring, etc.
- Fault and Performance Management: It helps in tracking and resolving the faults in the network beforehand with email & SMS alerting, root cause analysis, Syslog monitoring, network monitoring tools, and more.
- Storage Management: It helps in providing insights on disk capacity, RAID and storage arrays, tape library management, storage capacity forecasting, fabric switch management, and more.
- AIOps Features: It provides various AIOP features to enhance network monitoring, which includes precise forecasting with reports, performance trend forecasting, adaptive thresholds, and more.
- Integrated Data Center Monitoring: It includes integrated data center monitoring with 3D data center floor modeling, monitoring from a single web console, and more.
- High Scalability: It can scale up to 10,000 devices with high availability as the enterprise expands.
- Other Powerful Integrations: It includes various other add-ons and plugins, including network traffic analysis, network configuration management, switch port and IP address management, firewall log management, and more.
ManageEngine OpManager Benefits:
- Simplifies the network monitor from end to end by providing full visibility into the network infrastructure.
- Notifies you for any faults in the system through SMS or email.
- Provides customizable and user-specific dashboards.
- 3D rack views are available.
- An integrated mobile app is available for network monitoring on the go.
- Transparent and affordable pricing.
Why look for ManageEngine OpManager Alternatives:
- Based on customer reviews, it has a complex setup.
- It requires more time to configure.
- Poses integration challenges in heterogeneous environments.
- It is cumbersome to select modules.
Pricing: ManageEngine OpManager pricing plans:
- Standard edition: $245 for 10 devices
- Professional edition: $345 for 10 devices
- Enterprise edition: $11,545 for 250 devices
A free edition is available for small enterprises to monitor up to 3 devices. It also offers a free trial.
In this article, we did a thorough review of ManageEngine OpManager by analyzing its market share, expert advice, and some related FAQs. A comprehensive list of its main competitors is included, accompanied by a detailed analysis of each.

List of the Best ManageEngine OpManager Competitors
Here is the list to choose from:
- Paessler PRTG
- NinjaOne
- LogicMonitor
- SolarWinds
- Zabbix
- Dynatrace
- Datadog
- Nagios XI
- Auvik
- New Relic
- Progress WhatsUp Gold
- Cisco ThousandEyes
Comparing the Top ManageEngine OpManager Alternatives
| Software | Best for | Support | Free Trial | Pricing |
|---|---|---|---|---|
| ManageEngine OpManager | Full visibility and high scalability | Email, phone, live chat, Forum, knowledge base, video tutorials, webinars, and on-demand premium support with the paid version. | Free trial is available. | Starts with $245 for 10 devices. |
| Paessler PRTG | Real-time alerts and custom notifications. | Knowledge base, FAQs, video tutorials, webinars, phone, and email. | A 30-day free trial is available. | Starts with $2,149 per year for up to 50 devices. |
| NinjaOne | Automated endpoint management and robust integrations | Knowledge Base, Chat, Help Desk, Phone Support, FAQ, 24/7 live rep. | Free demo and trial offered. | Custom quote |
| LogicMonitor | Comprehensive, seamless monitoring with agentless architecture. | Live training, ticketing, chat, phone, email, knowledge base, FAQs, and self-help resources. | A 14-days free trial is available. | Starts with $22 per resource per month |
| SolarWinds | Keeping and providing a bird’s-eye view of your network. | Phone, email, free product training, tickets, knowledge base, and FAQs. | A 30-day free trial is available. | Starts with $1,856 |
| Zabbix | Monitoring IT infrastructure free of cost. | 24/7 global technical support, hands-on professional training, documentation, community forum, support portal, and social media. | Free | Free |
Detailed review:
#1) Paessler PRTG
Best for real-time alerts and custom notifications.

Paessler PRTG is an all-in-one monitoring software that monitors your bandwidth, servers, virtual environments, websites, VoIP services, and so much more, all from a single platform with real-time insights and effortless control to ensure your systems work smoothly and efficiently.
It shows the performance of the entire network at a glance, covering everything from network availability and health to traffic and bandwidth metrics.
Its setup is simple and easy. You only need to download the installer with just a few clicks. It also makes it easy to migrate from other monitoring tools without losing data with its auto-discovery and pre-configured device templates that simplify the process.
It is affordable as compared to its competitors and has saved substantial costs of network monitoring based on user reviews.
PRTG offers a free version wherein you can have a monitoring solution for up to 100 sensors for life, along with free alarms, reports, and mapping features covering network performance, data traffic, hardware, and software monitoring.
Features:
- Central Monitoring: Monitor your entire network centrally from one location. PRTG includes dashboards that show a quick overview of your entire network.
- Performance at a Glance: See the performance of your devices for effective monitoring and management with various graphs, which you can adjust based on your needs. Features like “Sunburst view” allow you to quickly assess the overall health of your entire network.
- Custom Alert: The real-time alerts make it easy to find and react to problems within the whole IT infrastructure.
- Compatibility: The Paessler PRTG solution is compatible with all major vendors, products, and systems, including CISCO, DELL, HP, IBM, Windows, Oracle, Apache, and more.
- Products: It offers a range of products, including IT infrastructure monitoring for all sizes, hosted monitoring for cloud and hybrid IT infrastructures, and more.
- Industries: PRTG is suitable for industries like healthcare, building, education, finance, and government.
Support: Knowledge base, FAQs, video tutorials, webinars, phone, and email.
Free Trial: A 30-day free trial is available.
Why we selected Paessler PRTG:
When we compared ManageEngine OpManager vs PRTG Network Monitor, we found that in PRTG, users are not required to select modules, unlike ManageEngine OpManager. Price-wise, PRTG is more affordable as compared to the ManageEngine OpManager for features you get.
In Paessler PRTG you don’t need licenses and add-ons for monitoring additional or distributed networks, unlike ManageEngine OpManager.
Pros:
- Intuitive and user-friendly interface
- Comprehensive network monitoring
- Fair and transparent licensing
- Easy to configure and operate
- Mobile friendly
- Pre-configured device templates
- In-depth reporting
- Flexible alerting
- Multiple user-interfaces
Our Review: Paessler PRTG is an all-in-one monitoring tool that offers so many effective solutions for effortless monitoring and network management requirements.
It has been trusted by over 5,00,000 users globally, including Pepe jeans, National Theatre, Rexroth, Virginia Tech, and many more, and has been recognized by various reputed industry analysts including Trustpilot, Gartner Peer Insights, PCMAG.COM, Capterra, G2, etc.
Pricing:
Pricing plans are as:
- The subscription plan starts with a three-year contract that is billed annually.
- It offers its services free of cost for up to 100 sensors.
- A free trial is available.
| License size | Wholesale Price |
| 500 + 12 months maintenance | $1934,10 |
| 1000 + 12 months maintenance | $3509.10 |
| 2500 + 12 months maintenance | $7289.10 |
| 5000 + 12 months maintenance | $12779.10 |
| XL1 + 12 months maintenance | $16109.10 |
#2) NinjaOne
Best for Automated endpoint management and robust integrations.
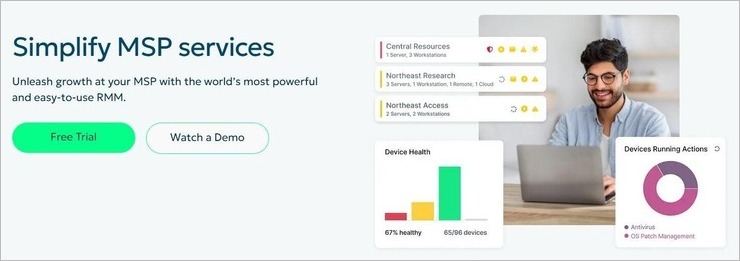
NinjaOne is an all-in-one endpoint management solution that grants you better visibility and control over all your devices across endpoints. It is a software that your IT technicians can use to simplify otherwise time-consuming IT operations. For instance, NinjaOne does a good job of automating various complex endpoint management tasks like patching and app installs.
NinjaOne, through its centralized dashboard, also ensures you can monitor all of your endpoints in real-time. This is one of the best tools out there to keep your hardware and software inventory safe from all sorts of threats. Technicians are immediately notified of a threat via the appropriate channels with relevant remediation suggestions.
Besides stabilizing devices and securing endpoints, NinjaOne also stands out for its user-friendly and intuitive interface. This makes the tool ideal for MSPs who seek nothing more than a solution that is easy to deploy and scale.
As a user of NinjaOne, you are also guaranteed excellent 24/7 support. Onboarding is free regardless of size and scale.
Features:
- Endpoint Management: With NinjaOne, you get an all-in-one endpoint solution that MSPs can use to automate even the most tedious IT tasks across endpoints.
- RMM: Remote monitoring and management is one of NinjaOne’s best features. You can count on the tool for proactive visibility and policy-based management.
- Mobile Device Management: NinjaOne also proves itself to be an efficient MDM tool that can be used to manage both Android and Apple devices across operating systems.
- Patch Management: The software facilitates automated patching. You can count on this tool to automatically detect vulnerabilities and deploy patches at scale.
- Backup: NinjaOne also features a cloud-native backup solution that comes in handy when it comes to ransomware recovery. It will encrypt your backups locally, in the cloud, or transit.
Support: Knowledge Base, Chat, Help Desk, Phone Support, FAQ, 24/7 live rep.
Free Trial: A free demo of the tool is offered upon request.
Why We Selected NinjaOne:
NinjaOne offers MSPs a complete package when it comes to endpoint management solutions. You get a cloud-native backup solution, an MDM, an RMM, and a solid ticketing system in one highly scalable solution. Plus, it is quite easy to use and even quicker to deploy.
Pros:
- Robust integrations with several third-party applications
- Real-time monitoring and alerting
- Automated endpoint management
- Flexible annual and monthly contracts
- Excellent 24/7 support
- Free onboarding support.
- Swift deployment.
Cons:
- Some users may find certain advanced features challenging to use initially.
Our Review: NinjaOne can automate some of the most complex and time-consuming endpoint management tasks. It features a user-friendly dashboard that makes it easier to gain visibility and control across endpoints. From simplifying IT operations to securing endpoints, we believe NinjaOne has a lot to offer that makes it a great alternative to OpManager.
Price: NinjaOne Patch Management offers flexible monthly and annual contracts. You’ll need to contact NinjaOne’s team for a custom quote. A free demo and trial is also available upon request.
#3) LogicMonitor
Best for comprehensive, seamless monitoring with agentless architecture.
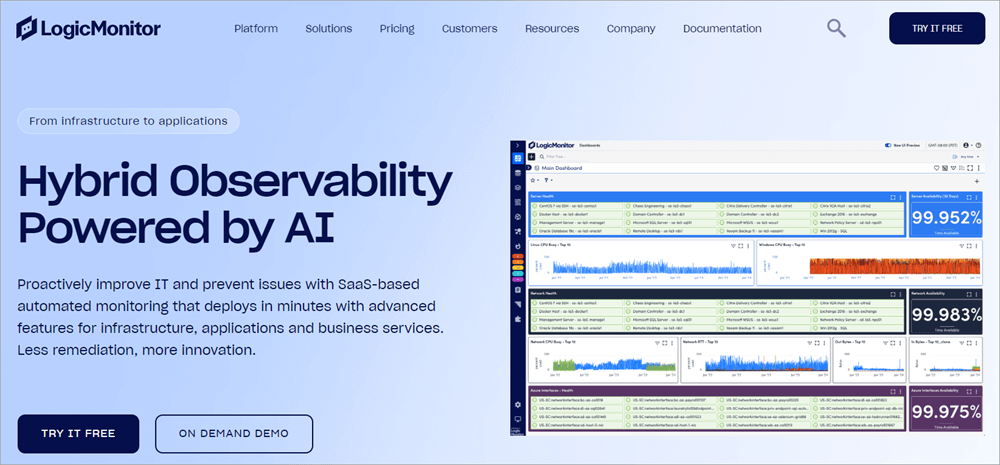
LogicMonitor is a SaaS-based automated monitoring solution that can monitor any IT environment. It can monitor infrastructure, cloud, containers, networks, servers, databases, storage, website uptime, log analysis, application performance, and more.
It provides deep insights into every factor to prevent any upcoming issue with an easy-to-use interface that does not require extensive configuration.
It offers an amazing set of solutions that suits every industry, from government to finance, healthcare to manufacturing, retail to software companies, and so on. It includes infrastructure monitoring, cloud monitoring, digital experience, digital transformation, cloud migration, automation, cost optimization, modernization, and so on.
Features:
- Quick and Easy Visibility: Quick and easy visibility into critical metrics of each part of the operations with dashboards for quick issue identification and resolution.
- Infrastructure Monitoring: Solutions for network, server, remote, virtual machine, SD-WAN, database, storage, and configuration monitoring.
- Cloud Monitoring: Insights over aspects like container monitoring, AWS, GCP, and Azure.
- Digital Experience: SaaS monitoring, website monitoring, and APM.
- Integrations: Over 3000 integrations available, including devices, technologies, and services like CISCO, AWS, HP, IBM, DELL, Zoom, Azure, etc.
- Security: Secured architecture, which executes operations and data collection using secured practices and standards.
Support: Live training, ticketing, chat, phone, email, knowledge base, FAQs, and self-help resources.
Free Trial: A 14-day free trial is available.
Why we selected LogicMonitor:
LogicMonitor has been selected for its guaranteed enhanced operational efficiency with 3000+ integrations, 90% less alert noise, and 40% reduced MTTR. With its AIOps early warning alerts, you can do real-time anomaly detection and troubleshoot issues before they occur.
Pros:
- Strong user authentication controls
- Threat modeling and security testing
- Certified with ISO/IEC 27001:2013 ISO/IEC 27017:2015 ISO/IEC 27018:2019 and SOC2 Type 2 standards
- Predictive infrastructure insights
- Consolidated monitoring tool
- Critical alerts with intelligent troubleshooting
- Real-time anomaly detection
Cons:
- Complex setup and implementation
- Requires web connectivity
- Easy-to-miss alerts for local network actions
Our Review: LogicMonitor is a comprehensive monitoring and alerting solution packed with solutions like automated alert thresholds, AI-powered early warning capabilities, intelligent data forecasting, flexible reporting, custom dashboards, etc.
It has been trusted by Siemens, Rentalcars.com, Kayak, Ted Baker, Pacific Life, and many more, and has been recognized by leading industry analyst websites including G2, Gartner, TrustRadius, and more.
Pricing:
- Pricing plans are as:
- Infrastructure monitoring: $22 per resource per month
- Cloud IaaS monitoring: $22 per resource per month
- Wire Access Points: $4 per resource per month
- Cloud PaaS & container monitoring: $3 per resource per month
- Log Intelligence: $4 per GB per month
- Edwin AI: Contact for pricing
- A free trial for 14 days is available, including full access to the platform with unlimited devices.
Website: https://www.softwaretestinghelp.com/top-logicmonitor-competitors/
Check our Detailed Review of LogicMonitor Competitors
#4) SolarWinds
Best for providing a bird’s-eye view of your network.
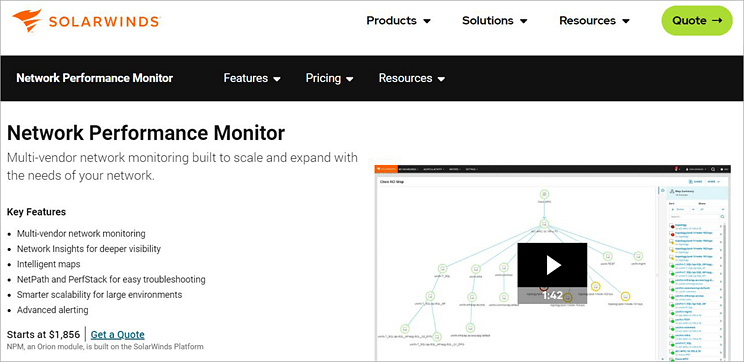
SolarWinds is one of the leading network management platforms suitable for every business, from small-scale to large enterprises or full-stack hybrid to multi-cloud.
Along with its amazing monitoring services, it also offers various other solutions to enhance the operational efficiency of the business. These include IT service management, database performance management, system management, application management, etc.
It is packed with an amazing set of features, including a Wi-Fi network analyzer, Wi-Fi monitor, LAN monitoring, network latency, network device scanner, and so much more. It offers various tools free of cost for small environments and includes tools related to network management, system management, IT security, database management, and IT service management.
Features:
- Network Device Monitoring: Discovers and identifies the network devices automatically to keep track of devices in your network along with dynamic mapping of devices, real-time performance visualization, and more.
- Dynamic Custom Network Topology Maps: Create dynamic custom network topology maps of your network devices to get performance metrics, connectivity, and link utilization.
- Deep packet Analysis: Analyzes your network, resolves end-user slowdowns, analyzes over 1,200 applications, classifies network traffic, and more.
- Automated Enterprise Network Monitoring Tools: Offers effective solutions to monitor the entire enterprise network in real-time with network scanning, visual representations of the network performance, network health analysis, and more.
- Streamlined Troubleshooting: Easily detect the issues related to routers, switches, firewalls, and load balancers by providing actionable insights on hardware health and capacity metrics.
- Other Features: Other features include network diagnostic tools, network latency tests, network monitoring alerts, network monitoring reports, network optimization, etc.
Support: Phone, email, free product training, tickets, knowledge base, and FAQs.
Free Trial: A 30-day free trial is available.
Why we selected SolarWinds:
SolarWinds was chosen for its outstanding ability to quickly identify and resolve network issues using its network performance monitoring tools. Its other solutions, like network utilization monitoring, troubleshooting outages, and visibility into network traffic patterns, are equally effective.
Pros:
- Fully customizable dashboards
- Provides up-to-date network topology maps
- Improves end-user experience
- Custom alerts
- Monitors on-premises and cloud-based network infrastructure
- Seamless conversion upgrade to AIOps
Cons:
- Customer support needs improvements.
- Bugs reported.
- Delayed dashboard status reported.
Our Review: SolarWinds is one of the leading platforms in the industry that provides solutions to help companies of any size accelerate their business transformation. Over 3,000 customers has trusted it worldwide, including many leading names like Amazon, Google, McDonald’s, and Walmart.
It has also been recognized with many awards and recognitions, including Gartner Peer Insights Customer’s Choice 2022, STEVIE winner in International Business Awards in 2022, Tech Ascension Awards, and so on.
Pricing:
- Offers various free tools for small environments, including various:
- Network management tools
- System management tools
- IT security tools
- Database management tools
- IT service management tools
- Pricing plans start with $1,856. For more information, you need to contact them.
- A free trial of 30 days is available.
Website: https://www.softwaretestinghelp.com/best-solarwinds-npm-competitors/
Check our Exclusive Review of SolarWinds NPM Competitors
#5) Zabbix
Best for monitoring IT infrastructure free of cost.
Zabbix is an open-source network monitoring software company based in the USA that is spread across Japan, Russia, Europe, and Latin America.
It can monitor anything by collecting, transforming, analyzing, and visualizing any form of data of any infrastructure effectively with its amazing set of features like metrics collection, problem detection, alerting, data visualization, security, integration, deployment, scalability, and so on.
It keeps control of your entire infrastructure through effective data collection, problem detection, alerting on critical issues, and widget-based dashboards. Zabbix also supports both on-premises and cloud deployment options, along with vendor support, ITSM integrations, Kubernetes monitoring, and more.
It has gained recognition from various industry analysts, such as G2, Gartner Peer Insights, TrustRadius, PeerSpot, Capterra, and more.
Features:
- Single View: Complete visibility into your entire IT infrastructure is provided in a single place via graphs, geo-maps scheduled reports, custom dashboard widgets, etc.
- Monitor Everything: Whether it is network monitoring website monitoring or any other monitoring like loT, sensors, database, cloud, server, etc., Zabbix offers solutions for everything.
- Alerts on Critical Issues: Supports multiple messaging channels like email, SMS, webhooks, communication platforms, etc. to notify you of the issues along with other features like message customization, auto-remediation, and more.
- Scalability: It can be scaled to any extent. Zabbix is an enterprise-ready platform that can be scaled from smart homes to multi-tenant enterprise environments.
- Smart Problem Threshold Definition: High-performance problem detection in real-time with root cause analysis, anomaly detection, trend prediction, and more.
- Professional Services: Backed with a wide range of professional services that you can augment with additional purchases.
Support: 24/7 global technical support, hands-on professional training, documentation, community forum, support portal, and social media.
Free Trial: Open-sourced platform.
Why we selected Zabbix:
We selected Zabbix as one of the popular ManageEngine OpManager alternatives as it provides its monitoring services free of cost. It collects data from any source easily and keeps control of your infrastructure smoothly with flexible metric collection, agentless monitoring, custom collection methods, and more. It detects problems instantly and alerts you on critical issues via multiple messaging channels.
Pros:
- Ensures data safety and security.
- Supports on-premises and cloud deployment options.
- Stores sensitive information in an external vault.
- Distributed monitoring.
- Unlimited scalability.
- 24/7 uptime.
- Backed by 250+ global partners.
- Enterprise-grade security
- Automatic agent deployment.
Cons:
- Complex setup and configuration.
- Performance dips are reported in very large networks.
- Limited support for cloud-based environments.
Our Review: Zabbix is a professionally developed platform that is open-source and can monitor anything with unlimited scalability, distributed monitoring, safety & security, high availability, and flexibility. It has been trusted by many reputed companies including DELL, NEXON, ICANN, SEAT, Orange, and many more.
Pricing:
- Zabbix is an open-source platform that offers its services free of cost.
- For professional technical services, you need to pay and contact them for the pricing.
Website: https://www.zabbix.com/
#6) Dynatrace
Best for proactively identifying connection issues in the network.

Dynatrace is an analytics and automation platform that monitors critical workflows and secures the entire IT infrastructure on a single platform. It is enriched with an effective set of features, including infrastructure and application observability, security analytics and protection, digital experience, automation, business analytics, and more.
Dynatrace proactively identifies connection issues by monitoring process-to-process network communications along with understanding network topology in dynamic environments by looking into a comprehensive overview of your virtualized network infrastructure. It has been recognized as a leader in network monitoring software via reviews by users in G2.
Features:
- Process-to-process Network Communications: Network analytics at the process level to ensure high-quality process communications over networks.
- Comprehensive Overview of the Network Infrastructure: Comprehensive overview of your network infrastructure to identify changes and to know the status of VMs, ESXi hosts, and cloud instances.
- Capacity Monitoring: Analyze the network traffic to identify process consumption and get insights for capacity planning.
- Integrated Monitoring: Monitor multiple aspects in a single tool in a single place, including user experience, application monitoring, server monitoring, and network monitoring.
- Other Solutions: Rich set of solutions including AI observability, log management and analytics, full-stack observability, cloud monitoring, application security, and so on.
- Integrations: Integration with over 650 cloud platforms and solutions, including AWS, Microsoft Azure, Google Cloud Platform, Kubernetes, Red Hat OpenShift, and many more.
Support: Documentation, community, chat, web, 24/7 assistance, and a 30-minute response time.
Free Trial: A 15-day free trial is available.
Why we selected Dynatrace:
Dynatrace has been selected for its 4 times faster software delivery, reliable and resilient services, and efficient and secure operations. It is the only platform that monitors process-to-process network communications and provides high-quality process communications over networks.
Pros:
- Automatic and exploratory root cause analytics.
- Automatic data collection.
- Automated observability for networks.
- Effective dashboards and smart alerting are present.
- Low latency, high throughput, and high redundancy.
- Support both hybrid and cloud environments.
- Efficient modernization and collaboration.
Cons:
- Complex setup.
- Slows down less robust systems.
Our Review: Dynatrace is a unified platform that ensures a secure and flawless digital experience in every industry. It offers various subscription plans that are based on hourly pricing and can be scaled as per your requirements. It has been trusted by top global brands, including DELL, Air Canada, BT, Money, and many more.
Pricing:
- Pricing plans are as follows:
- Host monitoring: Starts with $0.01 per memory-GiB-hour.
- Container monitoring: $0.002 per hour for any size pod.
- Digital experience monitoring: Starts with $0.0001 per property per session.
- Application security: Starts with $0.00225 per memory-GiB-hour
- Metrics powered by Grail: Starts with $$0.0007 per GiB-day
- Logs powered by Grail: Starts with $0.0007 per GiB-day
- Events powered by Grail: Starts with $$0.0007 per GiB-day.
- Automation: $0.13 per workflow-hour
- AppEngine Functions: $0.001 per invocation
- Platform Extensions: Starts with $0.0014 per 1000 spans.
Website: https://www.dynatrace.com/
#7) Datadog
Best for easy deployment, minimal maintenance, and unmatched breadth of coverage.
Datadog is a leading SaaS-based analytical platform for infrastructure monitoring enriched with a set of power features, including monitoring consolidation, DevOps, digital experience monitoring, real-time BI, on-premises monitoring, log analysis and correlation, etc. The setup process is simple; you can easily do it yourself without any professional help.
It provides deep visibility into tens of thousands of infrastructure metrics effortlessly. Under network performance monitoring, it provides real-time network insights, including TCP retransmits, latency, connection churn, network traffic, etc. to find the root cause of any issue.
Other solutions include network device monitoring, application performance monitoring, log management, cloud security management, error tracking, and so much more.
Features:
- Easy Setup and Deployment: You can start using it or monitoring your infrastructure easily without any need for prior skills or extensive training and it can be deployed in any environment: on-premises, hybrid, IoT, or multi-cloud.
- Deep Real-time Visibility: Thorough visibility into infrastructure performance, including continuous historical records.
- Effortless Managing: Effortless infrastructure management through simple deployment and an effective feature set.
- Other Features: Advanced correlation capabilities, among others.
- Compliance: Compliant with over 15 regulatory frameworks, including PCI DSS, SOC 2, HIPAA, GDPR, CIS, and more.
- Integrations: Integration with over 500 applications, serverless platforms, and Kubernetes including SAP, Amazon Cognito, AWS Database Migration Service, AWS OpsWorks, and more.
Support: Phone, email, chat, webinars, documentation, and support tickets.
Free Trial: A 14-day free trial is available.
Why we selected Datadog:
We selected Datadog as it facilitates effortless infrastructure monitoring with its commendable solutions like metrics, container monitoring, network performance monitoring, network device monitoring, serverless, cloud cost management, and cloudcraft.
In addition, it uses agentless technology to detect, prioritize, and fix security issues faster and more effectively.
Pros:
- Can be deployed on any environment including on-premises, hybrid, IoT, or multi-cloud.
- Tag-based search and analytics.
- No professional or extensive training is required.
- Reduce alert fatigue.
- Intuitive user interface.
- Regulatory compliant.
Cons:
- Tricky setup for complex IT systems.
- Data storage limits.
Our Review: Datadog is a unified monitoring platform for developers, IT operations teams, security engineers, and business users who need an automated infrastructure and application and log management solution for real-time observability.
It has been awarded many recognitions, including Analytics & DevOps 2020 in SD Times, 2019 Best of Interop, 2019 Best of VMWorld, and many more.
Pricing:
- Pricing plans are as:
- Free: $0
- Pro: $15 per host per month.
- Enterprise: $23 per host per month.
- DevSecOps Pro: $22 per host per month
- DevSecOps Enterprise: $34 per host per month.
- A free trial of 14 days is available.
Website: https://www.datadoghq.com/product/infrastructure-monitoring/
#8) Nagios XI
Best for ensuring optimal server performance.
Nagios XI is an extensible and comprehensive infrastructure monitoring software enriched with a bundle of easy-to-use and intuitive features including a powerful monitoring engine, capacity planning, configuration wizards, advanced user management, and so on.
It includes a powerful list of products: Nagios log server, Nagios network analyzer, Nagios Fusion, and Nagios Core.
Nagios XI is based in St. Paul, Minnesota, and was founded in 2007. It has been trusted by over 10,000 customers worldwide for its comprehensive products that include real-time data, high availability and failover, setup wizards, comprehensive dashboards, and many more.
Features:
- Network Analyzer: In-depth network insights for extensive network analysis to find potential threats with a centralized view.
- Comprehensive Dashboards: High-level overview of all the aspects of a network (network traffic, bandwidth, overall network health, etc.) and infrastructure to discover possible threats or risks coming your way.
- Customizable Architecture: Customizable GUI where you can tailor the layout and designs as per your preferences. There is also the opportunity to add both in-house and third-party applications.
- Proactive Alerts: Proactive alerts make you aware of possible infrastructure issues through SMS, email, text messages, Slack, etc.
- Advanced User Management: Introducing user-controlled configuration to efficiently manage user accounts.
- Other Features: Advanced graphs, auto-discovery, easy navigation, and so on.
Support: Phone, email, ticketing, and support forum.
Free Trial: A 30-day free trial is available.
Why we selected Nagios XI:
Nagios XI has been selected as one of the most powerful ManageEngine OpManager alternatives for its extensible and comprehensive monitoring capabilities that enable you to monitor networking devices, log data, flow data, etc. with its industry-leading solutions including Nagios XI, Nagios log server, Nagios Network Analyzer, and Nagios Fusion.
Pros:
- Comprehensive dashboards
- Advanced visualizations
- Specialized views and an automated alert system
- Robust and intuitive web interface
- Configuration GUI
- 65+ configuration wizards
- Open API
Cons:
- Security issues reported.
- Time-consuming configuration.
- Crashed database tables were reported.
Our Review: Nagios XI is an open-source solution that navigates the complexities of any IT infrastructure with its powerful solutions. The best feature of Nagios XI is its powerful monitoring engine that facilitates efficient monitoring and advanced graphs that clearly show the network incidents and enable users to resolve them before they become bigger issues.
It has been trusted by over 10,000 customers globally, including many popular businesses like BOSE, DHL, Panasonic, McAfee, and more.
Pricing:
- Pricing plans are as follows:
- Free: $0
- Standard: Starts with $2,495 per 100 nodes.
- Enterprise: Starts with $4,490 per 100 nodes.
- Sitewide: Contact for pricing.
- A free trial of 30 days is available.
Website: https://www.nagios.com/products/nagios-xi/
#9) Auvik
Best for providing ultimate visibility, security, and control over network devices.
Auvik is a feature-rich, cloud-based monitoring solution for network management that provides effortless control over your IT infrastructure at an astonishing speed. It finds the potential cause of the network issues faster and reduces the MTTR.
You can even manage your network management remotely with the Remote Network Management Solution, wherein you can have access to the network and troubleshoot issues without ever having to leave your desk.
Features:
- Ultimate Visibility: Comprehensive real-time view of network assets with automatic discovery, documentation, and interactive maps that intelligently analyze network traffic. Get quick access to device details from a centralized location.
- Simple Navigation: Enables real-time responses to network issues with simple network monitoring and troubleshooting.
- Pre-configured and Customizable Alerts: Over 50 pre-configured and customizable alerts to get notifications on your terms.
- Distributed Network Management: Add as many new sites as required and manage them efficiently. Auvik provides visibility of the performance and availability of your entire network in a central view.
- Automated Network Discovery: Effectively control the network with automated mapping inventory and documentation. The tool automatically discovers the network and keeps the information up to date.
- Other Features: Manage configuration backups automatically, integrations, visualize network topology, analyze network traffic, manage configuration backups, and more.
Support: Knowledge base, guides, reports, blogs, webinars, and phone.
Free Trial: A 14-day free trial is available.
Why we selected Auvik:
We selected Auvik for its feature-rich, cloud-based monitoring features that provide complete control over your network infrastructure. It ensures superior visibility with automatically updated maps, increased efficiency through centralized documentation, easier troubleshooting with over 50 effective customizable alerts, and increased operational efficiency.
Pros:
- Standardized dashboards
- Intelligent network traffic analyzer
- Network mapping and navigation
- Pre-configured and customizable alerts
- Proactive service delivery
- Strategic IT enablement
- Users can create workflows with Auvik APIs.
Cons:
- Improvements in traffic analysis are suggested.
Our Review: Auvik has been reviewed by many reputed industry analysts, including G2, Capterra, Peer Spot, and more. It covers industries like MSPs, state & local government, education, financial services, healthcare, and manufacturing.
It is suitable for users who want to discover and summarize all aspects of the network in a single place easily. It is best to provide ultimate visibility, security, and control over the network infrastructure.
Pricing: Contact for pricing.
Website: https://www.auvik.com/
#10) New Relic
Best for 30+ powerful capabilities to monitor the full stack.
New Relic is an all-in-one powerful observability platform enriched with a vast set of effective features including collaboration, change tracking, host monitoring, Kubernetes, dashboards, remediation, system health, network monitoring, and so much more.
It helps in monitoring, debugging, and improving the entire stack on a single platform along with monitoring almost every aspect of IT infrastructure including security, DevOps, web, network, cloud, Kubernetes, server, model performance, etc.
Its pricing model is easy to understand and predictable and provides 5 times more value to the business. It is usage-based or on a pay-as-you-go model wherein you only need to pay for the features that you require. It is the most powerful full-stack analysis.
Features:
- AI monitoring: Find bugs with in-depth insights into your whole network easily with AI-monitoring capabilities.
- Error tracking: Single place for tracking errors of the entire network ecosystem. You can resolve them and can keep an eye on them easily.
- Network performance monitoring: View the entire network framework collectively to find out the root cause of issues. You can also automatically find network anomalies with AI.
- Customization: You can explore any data at a glance by easily creating and configuring dashboards.
- Integrations: It can be integrated with over 750 applications and platforms, including Windows Services, Amazon CloudFront Web, Adobe Commerce Business Insights, and so on.
- Regulatory compliance: It is compliant with enterprise-level security regulations, including GDPR, A-LIGN: 27001, SOC2 TYPE II, and FEDRAMP.
Support: Knowledge base, documentation, FAQs, community, email, and support forum.
Free Trial: A free unlimited plan is available.
Why we selected New Relic:
New Relic has been selected for its huge list of amazing capabilities that increase operational efficiency. It is the industry’s largest open-source integration ecosystem of over 700 applications and platforms, including .NET, Windows Services, Amazon CloudFront Web, Adobe Commerce Business Insights, and so on.
Pros:
- 30+ capabilities
- 750+ integrations
- AI-powered insights
- Customizable dashboards.
- Automatic issue detection.
- Real-time collaboration via email, SMS, Microsoft Teams, and more.
Cons:
- Updated documentation required.
- Complex setup.
Our Review: New Relic is the most powerful full-stack analysis solution with complete visibility over the entire stack, AI-powered insights, unlimited scalability, and so much more. It has been trusted by over 16,000 global brands, including various top brands like Toyota, TOPGOLF, World Kinect, Adobe, and Shutterstock, and has been recognized in multiple review websites, including Gartner.
Pricing:
- Pricing plans are as follows:
- Data costs:
- Free: $0 up to 100 GB per month.
- Standard: Starts with $0.35/GB beyond the free 100 GB limit per month.
- Pro: Starts with $0.35/GB beyond the free 100 GB limit per month.
- Enterprise: Contact for pricing.
- User costs:
- Free: $0
- Standard: Starts with $10/first user and $99/additional user (maximum of 5) per month.
- Pro: Starts at $49 per user per month.
- Enterprise: Contact for pricing.
- Complete costs: Contact for pricing.
- Data costs:
Website: https://newrelic.com/
#11) Progress WhatsUp Gold
Best for intuitive workflows, system integrations, and unmatched out-of-the-box functionality.
Progress WhatsUp Gold is an AI-powered infrastructure management software that monitors networks, systems, applications, and the cloud with pinpoint accuracy and enables you to find the root cause of issues.
It monitors servers, routers, storage, wireless, virtual, cloud devices, etc.; generates alerts and reports on performance; and automates configuration backups.
It provides complete visibility of the network performance of different devices and applications through actionable insights generated on customizable dashboards, clearly visible through network mapping. It also generates customizable alerts through SMS, email, web, or Slack.
Features:
- Complete Visibility: Complete systematic visibility into network performance through network mapping and customizable dashboards.
- Automated Network Device Discovery: Automatically detects network devices, receives information regarding device type, vendor, serial number, firmware, and hardware installed on the devices, and creates detailed network topology maps.
- Real-time Alerts: Real-time alerts are based on your customized response strategy, allowing you to resolve issues quickly and efficiently.
- Deployment: On-premises and cloud.
- Supported Protocols: Multiple flow protocols including NetFlow, NSEL, QUIC, sFlow, J-Flow, and IPFIX.
- Other Features: IBandwidth consumption monitoring, Hyper-V and VMware monitoring, wireless networks monitoring, and more.
Support: Documentation, blogs, eBooks, support community, email, and phone.
Free Trial: A free trial is available.
Why we selected Progress WhatsUp Gold:
Progress WhatsUp Gold has been selected for providing monitoring capabilities in remote environments. Now you can monitor any number of remote sites accurately on all your network installations from one centralized place.
Pros:
- Unique interactive maps.
- Automated network device discovery.
- Custom network mapping.
- Simple and integrated log management.
Cons:
- Challenging feature utilization.
- Comparatively expensive.
- Limited customization.
Our Review: Progress WhatsUp Gold is best in providing features like automatic network discovery, real-time alerts, quick resolution, and log management. 70% of Fortune 500 companies rely on Progress products. It serves industries like education and various levels of government.
Pricing: Contact for pricing.
Website: https://www.progress.com/network-monitoring
#12) Cisco ThousandEyes
Best for collective view into internet health and internet insights.
Cisco ThousandEyes is a network management solution that provides enhanced visibility, AI-driven insights, and automated remediation to deliver a flawless digital experience.
It helps in proactively detecting the issues and remediating them promptly. It offers a very effective set of features like end-to-end visibility, optimized workflows, global vantage points, streamlined operations, and more.
It is best in providing rich insights from BGP routing data and integrating the IT ecosystem using native REST API along with providing access to IPv4, IPv6, and broadband cloud agents in over 195 metro areas across the globe.
Features:
- End-to-end Visibility: Complete view of critical metrics of networks and services in a single-correlated view and interactive visuals.
- AI-driven Intelligence: AI-driven insights on internet health to enable you to find outages and fix them beforehand.
- Closed-loop Operations: Automates critical processes and seamlessly connects them with other software. It facilitates optimized workflows and streamlined operations.
- Data Sharing: Quickly solve issues by sharing data across multiple teams via scheduled snapshot emails or live streaming.
- Simplified Troubleshooting: Automated anomaly detection and issue correlation to make you respond quickly and efficiently.
- Integrations: Integration with various other platforms for smooth data fluency like BigPanda, Slack, Splunk, Zenduty, and more.
Support: Email, chat, web, and phone.
Free Trial: A 15-day free trial is available.
Why we selected Cisco ThousandEyes:
Cisco ThousandEyes has been selected for providing a comprehensive view of data across all layers of the network. It also has a good user experience in finding issues and insights that matter. You can also use the global monitoring vantage points to have a 369° view of the digital services.
Pros:
- Internet-scale visibility
- Configurable dashboards
- Track and share performance insights
- Continuous performance data analysis
- Generates intelligent recommendations
- Shortens problem resolution time
- 24/7 live chat consultation
Cons:
- Missing certain essential capabilities offered by other competitors.
Our Review: Cisco ThousandEyes is recommended as the industry’s only collective view into internet health, providing deep insights into user experience across the internet. It is suitable for industries like retail, customer web, financial services, healthcare, the public sector, carriers, hosting, and more.
Pricing: Contact for pricing.
Website: https://www.cisco.com/c/en/us/products/cloud-systems-management/internet-cloud-intelligence/index.html#~product-overview
Frequently Asked Questions
1. What is ManageEngine OpManager used for?
ManageEngine OpManager is used for monitoring, managing, and securing the system with its various available expert solutions. It includes full visibility into networks, server management, storage management, fault and performance management, and so on.
2. What is better than ManageEngine?
The top ManageEngine OpManager Alternatives are:
• Paessler PRTG
• Logic Monitor
• SolarWinds
• Zabbix
• Dynatrace
3. Why choose ManageEngine?
You should choose ManageEngine for its powerful network and server monitoring capabilities, including server performance monitoring, server availability, server health monitoring, monitoring multiple remote sites, and so on.
Conclusion
Our research led us to the conclusion that ManageEngine OpManager is a viable option for large businesses; however, it has several limitations, including challenges with setup, configuration, integration in heterogeneous environments, and a cumbersome module selection process.
There are multiple ManageEngine OpManager alternatives available on the market, each one better than the last. For example, Paessler PRTG. Its setup is simple; you just need to download the installer with just a few clicks.
So, check the above-listed tools created after proper analysis for more insights on which tool is best for you.
Our Review Process:
- Time taken to research this article: We spent 20 hours researching and writing this article so you can get a useful summarized list of tools with a comparison of each for your quick review.
- Total ManageEngine OpManager alternatives researched online: 36
- Top tools shortlisted for review: 11
Was this helpful?
Recommended Reading
-

Application Performance Monitoring in DevOps: What is it, how to perform it, and top tools for automated Application Performance Monitoring We came to know more about Release Management in DevOps from our last tutorial. Another key aspect of DevOps is carrying out the Performance monitoring of the application in the…
-

List and Comparison of the Top Website and Application Performance Monitoring APM Tools: In this era of Information Technology, Application Performance Management (APM) monitors the performance of software applications. APM ensures it provides services to the customer up to the level defined and identifies the problems related to the application…
-

List with Comparison of the Best Cloud Monitoring Tools and Services: Cloud monitoring uses automated and manual tools to accomplish, monitor, and assess cloud computing plan, structure, and service station. As more and more industries understand the potential welfare of moving their setup to the cloud, there is an important…
-
List & Comparison of the Most Popular RMM Software Tools. Select the Best Remote Monitoring and Management Tool Based on Your Business Requirements: Remote Monitoring and Management Software is an application for Managed IT Service Providers who proactively and remotely monitor client endpoints, networks, and computers. It can be categorized…
-
Here we will compare and explore the top Synthetic Monitoring Tools and Services to guide you to select the best Synthetic Monitoring Tool for your business needs: Synthetic Monitoring tools or services are the solutions offered for verifying the performance, availability, reachability, and reliability of a website or application at…
-

Review of the Best Website Monitoring Tools and Services: When I open a website, I want it to run fast that too without any breaks. If what I expect is not available or if it has uptime with poor quality then I instantly switch to another website. And end up finishing…
-
Review the top WiFi Analyzers for Windows and Mac to select the best WiFi Monitoring Tool to optimize the network and improve security: Today, no home, office, or other modern facility can function without a high-speed WiFi network. This reality has a flip side, and that is a slow WiFi…
-
Review, compare and select the best Network Bandwidth Monitoring Software from the list to prevent any major network collapse in the future: You will experience a slow network connection, be it Internet or Intranet, and one of the main reasons for network delays is high bandwidth usage. Slow or bottlenecks…


