


Overview of Server Monitoring Tools:
In today’s busy world, any business requires strong infrastructure, well-established network connections, powerful servers to handle loads of users or transactions, etc., to succeed in their business.
Let’s imagine that your business is running smoothly but suddenly one server, a service, or an application gets down or crashes due to overload. What would be your reaction? What would be the impact of such downtime on your business, customer service, etc.?
This downtime will cost your business and it will impact productivity as well as service which may damage your reputation in the market.
Table of Contents:
- Server Monitoring Software: Market Trends
- Top Server Monitoring Tools
- #1) Robin by Atera
- #2) NinjaOne (Formerly NinjaRMM)
- #3) PRTG Network Monitor
- #4) ManageEngine OpManager
- #5) Site24x7
- #6) Pandora FMS
- #7) Nagios Core
- #8) Icinga
- #9) Anturis
- #10) Monitis
- #11) Ganglia
- #12) CollectD
- #13) AppDynamics
- #14) Op5
- #15) Datadoqhq
- #16) SolarWinds Server and Application Monitor
- #17) eG Innovations
- Other Server Monitoring Software
- Conclusion
Server Monitoring Software: Market Trends

Hence when the question arises of how you can keep your server running without any issues and make your client/customer happy?
The answer to this will be Server Monitoring.
- Server Monitoring means continuously monitoring or scanning the available servers in the network and detecting any failure in the server or network
- Server Monitoring is a preventive action that detects any failure before it causes some major issue to the network system
- Server monitoring includes monitoring the performance of applications, web services, IT Infrastructure, etc.
Server Monitoring is required to ensure that your server is running and the business transactions are getting saved as per the flow. Any crash, failure, or downtime in the server causes a huge loss to the business and the market reputation, so server monitoring is crucial to avoid all such downtime.
Our TOP Recommendations:
 |
|||
| Robin by Atera | NinjaOne | PRTG Network Monitor | ManageEngine |
| • Server Monitoring • Real-time alerts • Shared Script Library | • Custom-built network monitoring • SNMP Monitoring • Real-Time Monitoring | • File Server Monitoring • SLA Reporting • Maps and Dashboard | • Phone integration • Automated workflows • Push notifications |
| Price: Starts at $149/month Trial version: Available | Price: Fully Functional Trial version: 30 days | Price: Starts at $2149/yr. Trial version: Available | Price: $495.00 annually Trial version: 30 days |
| Visit Site >> | Visit Site >> | Visit Site >> | Visit Site >> |
Top Server Monitoring Tools
- Robin by Atera
- NinjaOne (Formerly NinjaRMM)
- PRTG Network Monitor
- ManageEngine OpManager
- Site24x7
- Pandora FMS
- Nagios
- Icinga
- Anturis
- Monitis
- Ganglia
- CollectD
- AppDynamics
- Op5
- AppNeta
- BigPanda
- SeaLion
- OpenNMS
- Panopta
- Stackify
- WhatsUpGold
- Datadoqhq
- SolarWinds Server and Application Monitor
- eG Innovations
Let’s begin with the Top Server Monitoring Software!
#1) Robin by Atera
Pricing: Robin offers an affordable and disruptive per-tech pricing model, allowing you to manage an unlimited number of devices and networks for a flat low rate.
You may opt-in for a flexible monthly subscription or a discounted annual subscription. You’ll have three different license types to choose from and can trial Robin’s full feature capabilities FREE for 30 days.
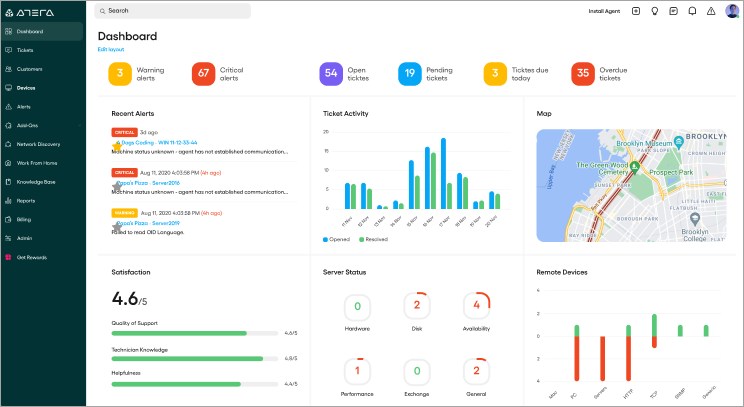
Robin is a cloud-based, Remote IT Management platform that provides a powerful and integrated solution, for MSPs, IT consultants, and IT departments. With Robin, you can monitor and manage all servers across all of your managed networks, with the Robin agent, for a flat low fee.
Additionally, Robin’s Network Discovery add-on instantly identifies unmanaged devices and opportunities. The ultimate all-in-one IT management tool suite, Robin Includes everything you need in one integrated solution.
Robin includes Remote Monitoring and Management (RMM), Network Discovery, Remote Access, Patch Management, Reporting, Script Library, Ticketing, Helpdesk, and so much more!
Features:
- Easily monitor server availability and performance, plus remote management such as remote access, software installation, patch management, and run scripts.
- Run automation profiles for ongoing maintenance and updates.
- Real-time alerting with the ability to add auto-healing scripts for self-resolution.
- Large shared script library.
- All the necessary add-ons, including security solutions, AV, DNS security, email security, disk encryption, backup solutions both cloud and local back-up, and a work-from-home solution to enable customers to remotely connect to office computers.
- No contracts or hidden fees, cancel anytime.
- 24/7 local Customer Support, 100% free.
- No onboarding costs.
Verdict: With its fixed pricing for unlimited devices, and its fully integrated server monitoring tools, Robin is truly the ultimate all-in-one IT Management tool that IT pros need. Try 100% free for 30 days. It’s risk-free, no credit card is required, and gain access to all Robin has to offer!
#2) NinjaOne (Formerly NinjaRMM)
Pricing: NinjaOne offers a free trial of their product. Ninja is priced on a per-device basis based on the features needed.
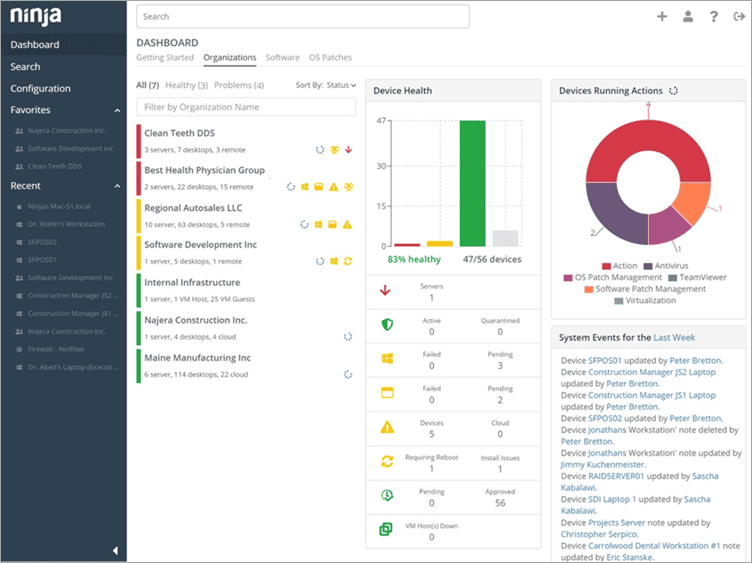
NinjaOne automates the hardest parts of IT, delivering visibility, security, and control over all endpoints for more than 20,000 customers.
The NinjaOne automated endpoint management platform is proven to increase productivity, reduce security risk, and lower costs for IT teams and managed service providers. The company seamlessly integrates with a wide range of IT and security technologies. NinjaOne is obsessed with customer success and provides free and unlimited onboarding, training, and support.
NinjaOne is #1 on G2 in endpoint management, patch management, remote monitoring and management, and mobile device management.
Suggested Reading => Open Source Monitor Tools – Reviewed List
Features:
- Monitor the health and productivity of all your Windows servers, workstations, laptops, and MacOS devices.
- Monitor the health and performance of all your routers, switches, firewalls, and other SNMP devices.
- Automate OS and third-party application patching for Windows and MacOS devices with granular controls over features, drivers, and security updates.
- Remotely manage all your devices without interrupting end-users through a robust suite of remote tools.
- Standardize the deployment, configuration, and management of devices with powerful IT automation.
- Get full hardware and software inventories.
- Directly take control of devices with remote access.
Verdict: NinjaOne has built a powerful, intuitive IT management platform that drives efficiency, reduces ticket volumes, and improves ticket resolution times that IT pros love to use.
#3) PRTG Network Monitor

PRTG Network Monitor is an all-in-one network monitoring solution to analyze your entire IT infrastructure. This easy-to-use solution can monitor all the systems, devices, traffic, and applications in your infrastructure. It provides everything and no additional plugins will be required.
It is a perfect solution for any business size. It can monitor all types of servers in real-time for availability, accessibility, capacity, and overall reliability.
Features:
- PRTG Network Monitor provides more than 12 sensors to monitor the mail server.
- It has various sensors that can be used immediately to monitor MySQL, Microsoft SQL, and Oracle SQL.
- It offers 20 sensors for file server monitoring.
- With the help of API, you can create your sensor for any situation.
#4) ManageEngine OpManager

ManageEngine OpManager is an integrated network and server management solution for efficient IT infrastructure management. OpManager checks the physical and virtual servers of your IT environment for health, availability, and performance.
It proactively monitors servers and applications with multi-level thresholds defined by the admin. It also monitors URLs, websites, event logs, server logs, Windows server processes and services, Microsoft Exchange servers, VMware ESX, and Guest OS servers.
All server data and network configurations can be viewed from a highly customizable dashboard on OpManager. The intuitive GUI provides an out-of-the-box overview that enables the user to monitor important server metrics such as usage, memory, and disk space, enabling server admins to take corrective actions.
OpManager thus offers in-depth visibility and complete control to get rid of all server-related issues with ease.
Check our ManageEngine OpManager Review Here
#5) Site24x7

Site24x7 is a cloud-based IT infrastructure monitoring solution that is available in tailored packages for server monitoring, network monitoring, application performance monitoring, multi-cloud monitoring, and website end-user monitoring.
As Site24x7 is a cloud-based monitoring tool, you don’t have to install it on your premises and there is no need to increase your existing server space requirements and can monitor from remote sites and on cloud servers.
The server monitoring feature supports monitoring of Windows, Linux, FreeBSD, and Mac OS platforms. It can also monitor virtualization platforms including Microsoft Hyper-V, VMware, and Docker containers.
Not just Microsoft Hyper-V, Site24x7 monitors the entire Microsoft ecosystem including SQL, IIS, Exchange, Active Directory (AD), Failover clusters, and Office 365.
The network performance of your devices and their interfaces can also be monitored with intuitive dashboards on device health and interconnections in your network. Cloud servers maintained in Microsoft Azure, Amazon Web Services (AWS), and Google Cloud Platform (GCP) can also be monitored by Site24x7.
For monitoring the other applications, databases, and web caches in your IT environment, you can use their ready-to-install 100+ plugin integrations including Nagios, MySQL, Oracle, Tomcat, and Apache. If you don’t find the plugin you are looking for, you can write your own using Python, Shell for Linux and PowerShell, VB, Batch, and DLL for Windows.
In addition to monitoring, the tool provides AI-powered insight on key performance indicators, automation capabilities for automatic fault resolution, threshold setting for each performance metric, in-depth performance reports, and third-party integrations for alerting.
Site24x7 is charged on a subscription basis, monthly or yearly. You can start monitoring 10 servers for $9/month and you get a 30-day free trial to try out the product.
#6) Pandora FMS
Pandora FMS (Pandora Flexible Monitoring System) is a powerful and very flexible tool that helps to detect server-related issues. It fits all your needs such as network monitoring, server monitoring, application issues, etc., within a single window. It does not wait for any notification, rather proactively it takes a step and anticipates the issues before they impact your business.
Features:
- Pandora FMS is powerful and flexible.
- Pandora FMS allows the consolidation of multiple data sources.
- It supports and generates different report types such as trends, Top-N, etc.
- It has a huge capacity and potential to store data.
- Pandora FMS monitors the performance of different server operating systems.
- It also monitors the status and performance of server applications such as web servers, database servers, etc.
#7) Nagios Core
[image source]
Nagios has a variety of ways to monitor server performance and resolve the issues. Nagios supports agentless server monitoring which it is easy to track and resolve the server issues. The easy web interface allows admin to control and configure the dashboard and this new customizable dashboard provides an overview of hosts, services, and network devices.
Features:
- Nagios Core supports around 3500 add-ons to monitor the server performance and issues.
- It supports different types of servers such as Windows servers, Solaris, Linux servers, and Unix servers.
- Using Nagios Core, server failure, failed services and processes can be detected easily.
- Nagios Core has minimized the downtime and due to this, the server availability has increased significantly.
- Variety of graph views provide information on capacity planning and suggest a plan for an upgrade as well.
#8) Icinga
[image source]
Icinga is a popular server monitoring system that keeps an eye on server performance and the network admin gets instant notification about the current status. Icinga is a branch of Nagios so it has a common functionality that will help in server monitoring.
Features:
- Icinga is an Open Source server monitoring tool.
- Icinga checks the availability of servers, and network services such as HTTP, SMTP, etc.
- It has a user-friendly user interface.
- Installation is easy and starts server monitoring immediately.
- Icinga supports the monitoring of server components such as switches, routers, etc.
- It supports network maps, reporting, performance graphs, etc.
#9) Anturis
[image source]
Anturis provides server monitoring for in-house servers and cloud servers. Anturis is a software-as-a-services for servers, databases, and web services. It is simple and affordable in terms of cost and minimizes maintenance complexities.
Features:
- Easy setup for server performance monitoring.
- It monitors CPU load, RAM, disk usage, etc.
- It supports alter notification in case of incidents.
- Capable of analyzing historical data.
- Anturis server monitoring tool supports customizable notifications email, voice call, and SMS.
- It not only helps in monitoring server performance but is also involved in operations such as connectivity between devices, checking open ports, etc.
#10) Monitis
Monitis is a server monitoring tool that keeps an eye on server performance and identifies any issues faster when compared to other tools. It is a cloud-based tool so all services can be monitored remotely which in turn saves time and cost.
It monitors the health, availability of servers, CUP load, disk, memory space, etc. It does not require any download and installation, you can log in to your account and start monitoring the server performance. It supports Windows & Linux servers and monitors the services for these servers.
Features:
- It is an Open Source tool.
- It monitors the CPU load, memory, and disk usage.
- Monitis server monitoring tool monitors the performance of the machine in the local network, network interface, and disk operations.
- Along with the server, it also monitors services, networks, websites, and applications.
- It also supports alerts and reports.
#11) Ganglia
[image source]
Ganglia has distributed architecture and is designed for monitoring systems such as Grids and Clusters. It uses XML for data representation and XDR for data transport. By comparing different hosts Ganglia can identify if any specific host has different behavior than others. It supports graphs and multiple graphs are combined.
Features:
- Ganglia is an Open Source monitoring system.
- It has a special feature to compare hosts across all the networks.
- It periodically checks the heartbeats i.e. by default after 20 seconds.
- It allows checking single metrics (E.g. disk space, CPU usage) on multiple hosts.
- It separates each graph from the aggregate graph.
#12) CollectD
[image source]
CollectD collects details about the system and application performance and stores the information in the format of RRD files. It collects statistics about the current running system and uses it for performance analysis. It monitors the performance bottleneck, identifies server overload, and notifies it to the admin through a different alert system.
Features:
- CollectD is an Open source tool.
- It is written in C++ and supports multiple operating systems.
- It also supports alert notifications.
- It collects data for memory, CPU usage, and capacity of the system.
- CollectD can be integrated with tools such as Graphite, Grafana, etc.
#13) AppDynamics
[image source]
AppDynamics is an application performance management solution. It provides detailed information about all the processes running on the server. It can integrate with ServiceNow, JIRA, and PagerDuty. AppDynamics monitors every device of the network infrastructure E.g. mainframes, and load balancer and it also supports VMware and Docker.
Features:
- AppDynamics view server health.
- Identify the performance issue and fix it immediately.
- Track different server metrics such as CPU usage, disk space, memory issues, etc.
- Application-centric server monitoring requires minimal set-up or configuration.
- Comprehensive server dashboard which includes CPU, Server, and disk-related data.
#14) Op5
[image source]
Op5 Monitor is a software product for the server and network monitoring tool. Op5 Monitor provides information about thousands of devices and will give real-time information about what is exactly happening and how it happens.
Features:
- It is the most scalable and flexible monitoring solution available.
- This tool handles a large number of devices, servers, services, etc.
- REST API within Op5 Monitor can connect securely to any third-party integration.
- Op5 Monitor provides different reports and can be easily understood.
- The single dashboard view provides easy access to network data and displays network health.
- It also predicts if any action is required in the future.
#15) Datadoqhq

Datadoqhq is a real-time performance monitoring tool and it gets the details from servers, databases, services, applications, etc.
It creates a drag-and-drop dashboard and then analyzes, and compares different performance metrics and events. It identifies issues from your application and drills down for a solution.
#16) SolarWinds Server and Application Monitor
SolarWinds provides an agent-less server monitoring software. It monitors the server performance, alerting any issues, reporting, server management, etc. The server management allows access to restart the server, kill processes, and restart services.
SolarWinds also monitors the server response time, services, memory, CPU load, and event logs.
Features:
- SolarWinds is a free server monitoring tool.
- It tracks the status and availability of servers.
- SolarWinds monitors real-time processes.
- Server issues are resolved faster and minimize the downtime.
- It monitors the server data storage capacity and disk usage.
- It has a customizable dashboard and creates graphs, reports, maps, etc.
#17) eG Innovations
Pricing: eG Innovations is available with various pricing options like Easy Evaluation (Cloud Deployed), Perpetual License (On-premise), Subscription (On-premises), SaaS (Cloud Deployed), and Hybrid Service (On-premise and cloud).
You can request a quote based on your unique requirements. A free trial is available for the Easy Evaluation plan.

eG Innovations provides server monitoring solutions that will give you centralized performance visibility for physical, virtual, and cloud servers. It supports more than 10 operating systems such as Windows, Linux, AIX, HPUX, Solaris, etc. You will get unified server monitoring, diagnosis, and reporting.
Features:
- eG Innovations will auto-baseline the metrics so that you will get to know the time when the server’s performance is abnormal.
- It provides a simple and consistent layer model to describe the functioning of different server hardware and OS.
- It provides in-depth analytics that helps server architects to optimize server infrastructure.
- You will get one console to monitor all server hardware and OS.
Verdict: eG Enterprise is the application performance and IT Infrastructure monitoring solution to monitor code, container, cloud, etc.
MSPs will find its broad capabilities for different server platforms, multi-tenant models, and ability to support other monitoring requirements including application performance monitoring, cloud monitoring, storage monitoring, etc. to be very useful. The platform will give you actionable insights on performance issues.
Other Server Monitoring Software
#18) AppNeta
AppNeta provides network performance monitoring and comprehensive insight.
It is a Software-as-a-Services (SaaS) platform and ensures that an end-user gets an exceptional experience and delivers business-critical applications successfully. It is an easy-to-use and cost-effective monitoring tool. It can monitor the network, and server performance remotely as well.
#19) BigPanda
It is a software-as-a-service (SaaS) platform and it simplifies troubleshooting in a complex environment. It quickly identifies the issue with its corresponding root cause and takes action immediately.
#20) SeaLion
SeaLion is a Linux monitoring tool and it quickly detects issues with multiple Linux servers. It is available in a web browser and is simple to use. SeaLion can compare the output of one server with another to verify why the performance of one server is different than others.
The dashboard of SeaLion provides a graphical interface for your server activities. It also has a facility of email alerts when the server is overloaded.
#21) OpenNMS
OpenNMS is a Network Performance management tool. It is an open-source tool and does not require maintenance costs. OpenNMS has an event-driven architecture and it can handle thousands of events. Whenever services, nodes, and interfaces are down then such events are created. It can monitor the applications and services remotely.
#22) LogicMonitor
LogicMonitor is a Software-as-a-Service (SaaS) platform and it provides performance monitoring. It also supports reporting and email notification in case of potential issues.
LogicMonitor provides pre-configured monitoring of routers, servers, switches, databases, and applications from a single web-based console.
Further Reading => Check Our Detailed Review of LogicMonitor Competitors
#23) Panopta
Panopta includes an advanced server and a monitoring system. It is a Software-as-a-Service-based platform and it monitors servers, applications, and network performance.
With the help of this tool, you can customize the alert so that you can respond only to the alerts to which you want to respond. It also provides real-time reports on different metrics. It also serves as the Outage Management System for online businesses. It helps in minimizing the impact of the outage on online businesses.
#24) Stackify
Stackify is a cloud-based platform and it monitors the cloud-based applications. Stackify detects the issues in the application quickly and resolves them immediately so that their customer is satisfied.
For any issue in the application, Stackify tracks the deep level of details about the application to help fix any issue quickly.
#25) WhatsUpGold
WhatsUpGold is not only a scanning network but it also understands the architecture of a network using routing protocols and tables. To make efficient use of licenses, WhatsUpGold eliminates duplicate devices from the network.
It also provides inventory reports on network assets, hardware, and warranty status quickly. WhatsUpGold continuously monitors servers, identifies problems, and fixes them immediately. It monitors the performance, CPU usage, traffic load, temperature, etc.
Conclusion
In this article, we have learned about several Server Monitoring Tools and still, there are various other server tools used in different organizations. Benefits derived and cost involved is completely based on the usage of the tool
Recommended reading =>> Top Synthetic Monitoring Solutions
Not all Server monitoring tools are capable of monitoring the slow performance, exceptions in the application, response time, restoring application server, etc, and many organizations use log monitoring and analytics systems to overcome such issues.
Over to you now !!
Was this helpful?
Recommended Reading
-

List and Comparison of the Top Website and Application Performance Monitoring APM Tools: In this era of Information Technology, Application Performance Management (APM) monitors the performance of software applications. APM ensures it provides services to the customer up to the level defined and identifies the problems related to the application…
-

Evaluate the top Cost Monitoring Software for Azure with features. Select the best Azure Cost Monitoring tools to analyze, manage, and monitor your overall costs across all Azure services: In the ever-evolving landscape of cloud computing, managing costs efficiently as an organization grows its footprint in Microsoft Azure is a…
-

This Article Lists the Top Hardware Monitoring Tools along with their Features, Comparison, and Pricing. Select the Best Hardware Monitoring Software Today: Hardware Monitor Tool is a software that communicates with various hardware components and provides the values of physical properties of these components in an easy-to-understand format by fetching…
-
Read this review and comparison of the top Infrastructure Monitoring Tools and Services to select the best Infrastructure Monitoring Tool: Infrastructure Monitoring Tools and Services are solutions to help the engineering team maintain and optimize the IT infrastructure through metrics, visualizations, and alerts. These Infrastructure Monitoring solutions will improve operational…


