Discover the most powerful alternatives that perform beyond LogicMonitor. Explore the top LogicMonitor Competitors and pick the best LogicMonitor alternatives to perfectly elevate your IT monitoring needs:
If you’ve been working as a system administrator, data scientist, or engineer, you’ve probably heard about LogicMonitor. It is hailed by most IT teams across the globe as one of the best cloud-based network monitoring tools today. It has amazing monitoring capabilities and will give you total visibility of your cloud services, servers, and network performance.
That said, LogicMonitor isn’t without its fault. For one, its monitoring capabilities are limited. It is also available as a SaaS. It also falls behind in licensing and analytical capabilities. LogicMonitor isn’t going to be everybody’s cup of tea.
Table of Contents:
Replacements for LogicMonitor – Competitive Alternatives

Fortunately, there are alternative solutions that more than compensate for what LogicMonitor lacks. Having used most of these tools, I can confidently suggest today’s top options.
So, without much further ado, let’s dive into the top LogicMonitor Competitors.

[image source]
Who is this article for?
This article will benefit all businesses that want to monitor their entire IT stack in real-time, people with multiple offices across regions, and professionals working in the realm of IT, especially data scientists, engineers, and system administrators.
How did I select the LogicMonitor competitors mentioned in this article?
To be a great alternative to LogicMonitor, I needed the tools to check some crucial boxes. I considered the following factors when making my decision and encourage you to do the same:
#1) Define Requirements: Before you decide to invest in a tool like LogicMonitor, understand why you need such a tool. Determine what you wish to monitor and whether the concerned tool can meet your requirements.
#2) Monitoring Features: If you are going for a monitoring tool, pay heed to the features they are offering. Ideally, I would recommend settling for a tool that facilitates real-time monitoring. Also, make sure it has features like an advanced alerting system and a customizable dashboard.
#3) Scalability: Businesses grow. As such, you’ll need a solution that is easy to scale to accommodate the requirements of your growing business. Your monitoring software should have no issues adding new devices and components as you grow.
#4) User-friendliness: The tool you choose should be low on the complexity scale, especially when it comes to deployment and usability. Make sure it has a UI that is comprehensive and easy to navigate. The installation process should also be simple.
#5) Reporting: Go for tools that offer advanced reporting capabilities, preferably ones that deliver real-time actionable insights. You can rely on such tools to help you rectify errors in real time.
#6) Vendor Reputation: Like with anything you buy, consider vendors that have a solid reputation in the industry. You can trust such vendors to deliver a product that is top-notch when it comes to performance, functionality, and usability.
#7) Support and Training: With tools like LogicMonitor, strong support is non-negotiable. Make sure the vendor offers 24/7 support via various channels. The support should be quick and responsive.
#8) Cost: Determine your budget before you venture out in search of a LogicMonitor alternative. Do not compromise on price. Always prioritize value and understand what you are getting for the price you just paid.

List of the Best LogicMonitor Competitors
Select from these popular alternatives:
- Paessler PRTG
- Site24x7
- SolarWinds NPM
- Sematext
- Logit.io
- Atatus
- Auvik
- Zabbix
- Datadog
- Dynatrace
- Sumo Logic
- IBM Instana
Comparing the Top LogicMonitor Alternatives
| Name | Best for | Top Features | Price | Rating |
|---|---|---|---|---|
| LogicMonitor | Providing total visibility into your cloud services, servers, and network performance | AI powered hybrid observability. | It starts at $3 per resource/month | |
| Paessler PRTG | Preconfigured sensors and a customizable dashboard. | Distributed monitoring, Maps, Multiple UIs | It starts at $1934,10 for [License Size: 500 + 12 months maintenance] | |
| Site24x7 | In-depth network analysis | Built-in reports, Sensor monitoring, Device mapping. | Starts at $42/month | |
| Sematext | Pre-built dashboards and out-of-the-box alerts. | Inventory monitoring, Container monitoring, Database monitoring | Starts at $3.6/host | |
| Logit.IO | Data consolidation | Jaeger UI, OpenSearch, Ingestion pipelines. | Starts at $4/month | |
| Atatus | Full stack monitoring | Real user monitoring, Synthetic monitoring, and Application performance monitoring. | Starts at $0.07/host hour per month. | |
| Auvik | Network visibility and out-of-the-box alerts | Inventory Monitoring, Alert Overlay, Network Mapping. | Quote-based |
Detailed Reviews
#1) Paessler PRTG
Best for pre-configured sensors and a customizable dashboard.
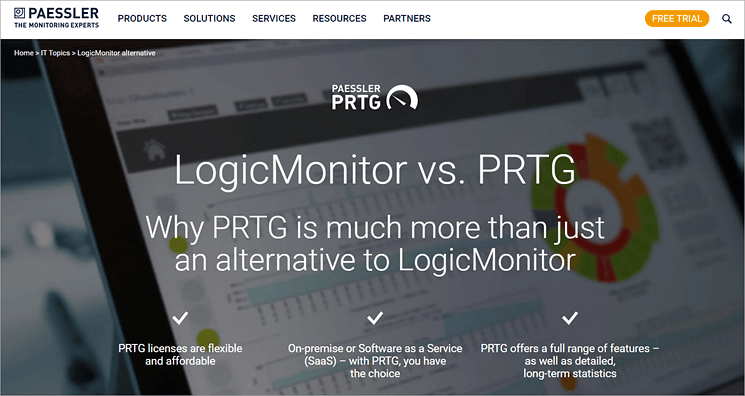
As far as network monitoring tools go, Paessler PRTG is widely hailed as one of the best by system administrators worldwide. While it competes with LogicMonitor in some aspects, PRTG also outperforms the latter in other areas. Its main purpose is to help you visualize and monitor your whole infrastructure, a job it does efficiently.
Once launched, it will immediately grant you complete visibility into your IT infrastructure, letting you monitor all servers, applications, system devices, and traffic within it. While LogicMonitor offers out-of-the-box monitoring capabilities, its abilities are limited when compared with PRTG. This is largely because PRTG offers over 250 pre-configured sensors to make monitoring simple.
Besides the pre-configured sensors, you can also create your custom sensors without hassle. There are many different ways to customize monitoring. PRTG also provides its users with detailed long-term statistics and historical data, something LogicMonitor lacks. PRTG can generate statistics as far back as you need them.
Another area where PRTG outshines LogicMonitor is in the deployment department. LogicMonitor is only available as a SaaS. However, PRTG is available as an on-premise and a cloud-based solution. Its billing is flexible and the tool itself is easy to install and launch.
How Paessler PRTG works:
- Download and launch Paessler PRTG by adhering to the provided installation guide.
- Configure the tool depending on what you wish to monitor in your infrastructure.
- Use Paessler’s sensors and Auto-Discovery feature to start monitoring.
- Paessler PRTG gathers data from monitored devices and presents it to you via the central dashboard.
- You have the option to set up alerts or notifications anytime an issue is detected. You can have these alerts sent to you via email or SMS or, as defined through a notification template.
Features:
- Maps and Dashboards: PRTG keeps you informed on the status of devices on your network via real-time maps and dashboards. You get live status information. You can use the map designer to create a custom dashboard.
- Alerts and Notifications: You can set up alerts and receive them via phone, email, and other mediums. When a problem or unusual metric is detected, the alerts will trigger automatically. You can set custom thresholds to control your monitoring.
- Customizable Reporting: Paessler PRTG is excellent at gathering data from monitored devices and presenting them via comprehensive reports. These reports convey the status and health of your network. The reports can be customized based on your specific needs.
- Multiple User Interfaces: Paessler’s interface is easy to navigate and understand. PRTG is available as a desktop and mobile app. You can use the desktop app to monitor multiple objects or even use the mobile app to monitor on the go.
- Distributed Monitoring: PRTG enables global monitoring, allowing you to access the health of your entire IT infrastructure across multiple locations. The monitored data is collected and presented to you via a single pane of glass. There is no limit to the number of remote locations you can monitor.
Why I like it:
For LogicMonitor VS. PRTG, Paessler PRTG has the upper hand. The extensive monitoring capabilities, flexible licensing, and detailed long-term statistics that can go as far back as you need them all make Paessler PRTG a tool worth checking out.
Pros:
- Available as a cloud-based and on-premise solution
- Detailed long-term statistics.
- Flexible pricing
- Easy-to-use user interface.
Cons:
- PRTG can be a bit complex in the initial implementation stage.
Our Review: Paessler PRTG outshines LogicMonitor in various crucial aspects. Thanks to the pre-configured sensors, PRTG’s monitoring capabilities are superior to LogicMonitor. It comes loaded with all the features system administrators need to monitor their servers, cloud services, and other devices.
LogicMonitor’s pricing is also less appealing than PRTG. PRTG is one of the best LogicMonitor competitors out there.
Price: Paessler PRTG offers the following subscription plans based on how many aspects of a device in your network you want to be monitored:
| License size | Price |
| 500 + 12 months maintenance | $1934,10 |
| 1000 + 12 months maintenance | $3509.10 |
| 2500 + 12 months maintenance | $7289.10 |
| 5000 + 12 months maintenance | $12779.10 |
| XL1 + 12 months maintenance | $16109.10 |
A free trial and demo are available upon request.
#2) Site24x7
Best for in-depth network analysis.
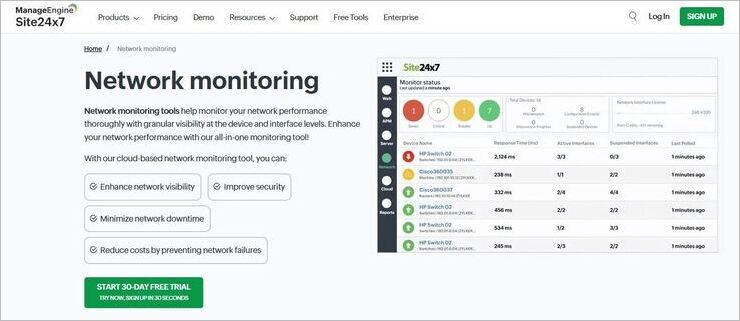
Site 24×7 is another feather in ManageEngine’s illustrious portfolio of solutions. This one stands tall for its network monitoring capabilities. You’ll find a complete suite of solutions taking care of all of your network security and monitoring requirements.
From performance and traffic monitoring to network configuration management and SD-WAN monitoring, Site 24×7 can do it all. The tool made it to my list because of its ability to go in-depth with network analysis. This makes the platform effective in getting to the root cause of network issues, which is essential for getting rid of these problems for good.
The tool is also highly scalable. Whether it’s monitoring the network of a local office or doing so on a global scale with a massive infrastructure, Site 24×7 has you covered. The platform has also evolved significantly with AI-based capabilities to boast. You can use AI models offered by Site 24×7 to enhance your monitoring potential.
Features:
- Real-Time Performance: A centralized health dashboard makes performance monitoring very simple via Site 24×7. You are kept up-to-speed on network performance with continuous insights.
- Device Discovery: The tool facilitates hassle-free device discovery and mapping. It does so with layer 2, layer 3, and topology maps. The solution also lets you leverage SNMP to automatically discover devices across the network.
- Multi-Vendor Device Support: The tool can be used to monitor up to 450 vendors and over 11000 device types. You get ready-to-use device templates for easy monitoring.
- SNMP Traps: You get SNMP Traps, which can be converted into actionable alerts. The trap processing can also be used to trigger workflows or decode MIB definitions. You are notified almost instantly when a fault is detected.
- Built-In Customizable Reports: Reporting is another one of Site 24×7’s impressive capabilities. You get reports that can be customized in accordance with teams or audits. The customization can also be done to meet compliance requirements.
Why I Like It
I like the third-party integrations. The tool can integrate seamlessly with many third-party apps like Jira and Slack. The tool is highly scalable and excels at real-time monitoring. The centralized dashboard truly elevates the user experience.
Pros
- Third-party app integrations
- Customizable reports
- Over 11,000 device types supported
- Custom dashboard
Cons
- Some advanced features require additional payment.
Verdict: Quite comprehensive in its capabilities, Site 24×7 is a great all-in-one network monitoring tool. You can use it to discover, monitor, and optimize your network’s performance from a single pane of glass. At $42/month, it is also quite reasonably priced.
Price: Site 24×7 offers premium plans.
- Professional: $42/month
- Enterprise: $625/month
Site 24×7 offers a 30-day free trial.
#3) SolarWinds Network Performance Monitor
Best for advanced network troubleshooting.
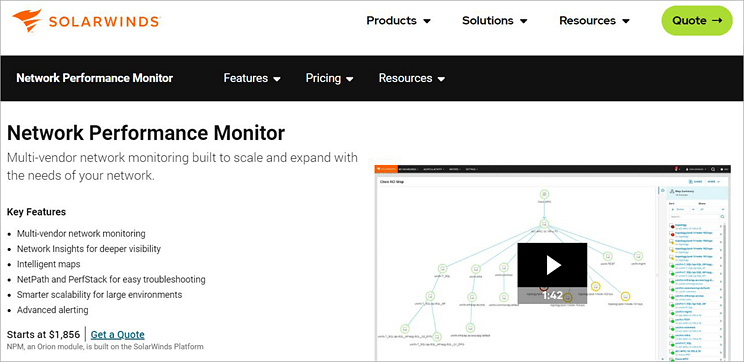
With SolarWinds NPM, you get a tool that excels at comprehensive network fault monitoring and fault management. It is quite powerful and grants you complete visibility into performing all devices, servers, etc. on your network.
Recently, the tool has gone through several updates that have only made it better at monitoring. You can rely on the tool to monitor and assess the fault, availability, and performance of all Cisco devices on your network. The tool is also great at performing deep packet inspections.
You can rely on the tool to get an immediate insight into network issues like internet slowdowns. You can also use the software to keep an unwavering eye on your endpoint devices.
Features:
- Enterprise Network Monitoring: Enterprise-network monitoring is the reason to consider using SolarWinds NPM. It will grant you end-to-end visibility into your entire network in real-time and help you discover all nodes in your network, gather performance data, and troubleshoot issues automatically.
- Scanning: The tool scans your entire network to discover legitimate and rogue devices. It can scan by IP range, IP address, and Active Directory. It can take the tool anywhere from minutes to hours to discover all devices on your network.
- Data Visualization: The tool can automatically generate a visual representation of your entire network. It also allows you to manually visualize your network. The visualization helps you accurately pinpoint the source of error on your network.
- Network Diagnostics: You can rely on the tool to quickly diagnose and fix network faults. You are immediately and automatically alerted if a network performance issue is detected. You get in-depth network insights that could come in handy when resolving performance issues.
- Network Mapping: The software comes with a network mapping tool, which you can use to create custom maps and graphs. The maps can help you identify connections between multiple devices on the network.
Pros:
- Advanced analytics
- Critical path visualization
- Intelligent mapping
- High scalability
Cons:
- The support needs to be quicker when responding.
Our Review: With SolarWinds NPM, you get a network performance monitoring tool that is built to scale. The tool stands tall and can even give LogicMonitor a run for its money, thanks to multi-vendor network monitoring capabilities, intelligent maps, and an advanced alerting system.
Price: SolarWinds NPM subscription plan starts at $1856. A perpetual license of the tool will cost you $3592. You can contact the SolarWinds team for a free demo or a custom plan.
Check our Detailed Review of SolarWinds NPM Competitors
#4) Sematext
Best for pre-built dashboards and out-of-the-box alerts.
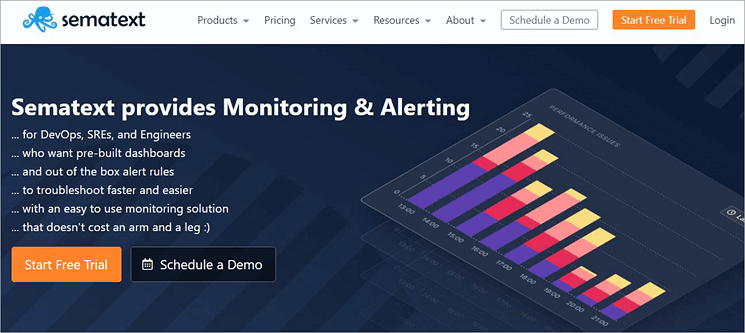
With Sematext, you get a monitoring tool that specifically caters to the needs and requirements of DevOps teams. You can rely on this tool to visualize and monitor your entire IT infrastructure in real-time. Several reasons make it a great alternative to LogicCompetitor. For starters, Sematext facilitates cloud-ready integrations.
The numerous integrations that Sematext facilitates help you gather data on various elements across your entire IT stack. You get a real-time view of both your enterprise and cloud infrastructure. Sematext’s abilities aren’t restricted to monitoring the status and health of your infrastructure, though.
You can count on the tool to facilitate real-time visualization of your entire network topology, which contains all servers and containers. Sematext automatically discovered and collected communication data. Alerting is another area where Sematext shines.
Sematext considers certain pre-defined conditions and uses them as a basis for automatically creating a set of default alerts. The tool alerts you to various problems, such as high system load, high CPU usage, critical disk space utilization, and more.
How Sematext works:
- Log into your Sematext dashboard.
- To kick-start monitoring, you’ll need to create a monitoring app.
- Navigate to “Monitoring View”, select integration, and then create a monitoring app.
- Configure the necessary app settings as per your preference.
- Install the Sematext agent along with a token that links to your Sematext account on your host machine.
- Navigate to your dashboard where you can gather and mix data from multiple apps to create reports, charts, etc.
- Schedule the monitor to run at specified intervals.
Features:
- Server Monitoring: The tool presents you with metrics that help you learn how your servers were used or are being used. You’ll get metrics on your CPU, memory, disk usage, load, network, etc. You get an aggregate top-down view of all your infrastructure.
- Container Monitoring: Sematext will help you visualize docker data in real-time. The tool visualizes container-specific metrics for load, network, IO, disk usage, CPU, etc. You’ll be alerted on any container metric, Docker host, or log pattern.
- Database Monitoring: The tool facilitates efficient database monitoring regardless of where you are running your databases. You’ll get a complete overview of your MariaDB and MySQL health. All traffic coming in and out of databases is monitored.
- Inventory Monitoring: The tool can identify and then categorize infrastructure into distinct sets to point out misconfigured. The tool can gather machine metadata and track all hardware configurations. You can use the tool to search, filter, and group various inventory data.
- Application Performance Monitoring: You can use Sematext to monitor application performance and the experience of real users. The tool performs deep-dive analysis to find the root cause of certain performance issues. It can monitor the availability of web applications as well.
Why I like it:
Sematext is a tool designed by DevOps professionals to cater to the unique needs of the DevOps team. It is easy to set up, features an excellent alerting system, and stands apart among its competitors by offering over 100 out-of-the-box integrations.
Pros:
- Over 100 out-of-the-box Integrations
- Predefined alert rules
- Multiple map views
- Real-time monitoring
Cons:
- Nothing significant
Our Review: Sematext makes it on my list for its impressive alerting and monitoring abilities. This easy-to-use tool is ideal for DevOps, Engineers, and SREs who want to stay on top of network issues from the beginning and troubleshoot them as quickly as possible.
Price: Sematext offers a plethora of subscription plans:
- The monthly plan starts at $3.6/host
- The annual plan starts at $3.2/host per month.
A free trial and demo are available upon request.
Website: https://sematext.com/
#5) Logit.IO
Best for data consolidation.

Logit.IO is a tool I would recommend for efficient cloud application monitoring. Once launched, you can rely on Logit.IO to give a profound insight into your applications. You’ll be able to monitor all applications across your entire technological stack and even troubleshoot any issues plaguing them without hassle.
As a cloud application monitoring tool, Logit.IO benefits a variety of players in the tech industry. Developers can use the tool to expedite the deployment of their code. It can also help QA professionals to enhance the quality of testing. You can count on the tool to monitor applications across on-premises, cloud, and hybrid environments.
Where the tool shines is in its ability to consolidate data on monitored applications. All logs, metrics, and traces are consolidated by this tool and presented to you via the central dashboard.
The tool is easy to install and use. However, if you are facing an issue, you can always rely on Logit.IO’s in-house engineers to guide you. They’ll help you collect data from your applications and preferred programming languages.
How Logit.IO works:
- Launch Logit.IO and navigate to the stack settings page.
- Hit the “Launch APM” button at the top.
- On the APM page, select “Statistics” to get stats related to your application usage.
- You can also view audit logs and telemetry inputs from this page.
Features:
- Alerting and Notifications: Logit.IO can help you receive alerts with the help of various built-in integrations. You get to choose from a variety of notification options. You can customize the alerts directly from the Logit.IO interface.
- Ingestion Pipelines: Logit.IO is excellent at collecting, processing, and preparing data for storage and analysis. This makes the tool ideal for businesses that deal with complex data environments. You can change and modify your data before it is indexed via the ingestion pipeline.
- OpenSearch: The tool stands out for its use of OpenSearch Dashboard. Users know this dashboard for creating customizable data visualizations, such as charts and graphs. You can rely on this dashboard to visualize data from various sources, like databases and log files.
- Jaeger UI: Jaeger is a distributed tracing tool that can help you monitor and troubleshoot complex architectures. The tool helps you visualize traces and spans. The Jaeger UI is exceptional at helping you visualize your entire APM stack.
- Infrastructure Statistics: The tool presents you with detailed stats on the performance and usage of various components within your IT stack. The usage insight you get can optimize your infrastructure’s performance monitoring. It can also prove useful in cost management.
Why I like it:
Logit.IO features all the qualities I need in a monitoring tool. The flexible licenses and easy setup make the tool worth checking out. However, the UI ultimately makes the tool one-of-a-kind.
Pro:s
- Log collection
- Trace analytics
- Quick alerts on system errors
- Flexible pricing
Cons:
- The documentation can be a hassle to navigate through.
Our Review: Logit.IO is an excellent LogicMonitor alternative if you are looking for a powerful cloud application performance monitoring tool. You can count on the tool to monitor, assess, and troubleshoot issues plaguing your applications on-premises, in the cloud, or hybrid environment. The tool especially stands out for the integrations it facilitates and its ability to visualize data.
Price: Logit.IO offers the following pricing plans:
- Development: $4/month
- Individual: $20/month
- Small Team: $40/month
- Business: $80/month
Website: https://logit.io/platform/observability/cloud-application-performance-monitoring/
#6) Atatus
Best for full stack monitoring.
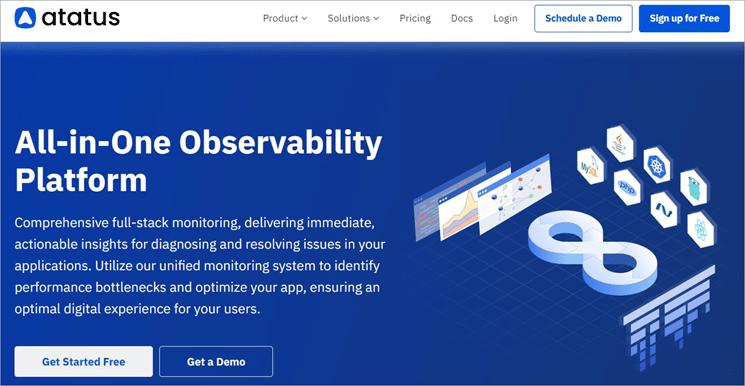
Like LogicMonitor, Atatus promises you comprehensive full-stack monitoring. The tool immediately gets to work upon launch by identifying, analyzing, and troubleshooting issues found in your network. Atatus features an easy-to-navigate central dashboard, which you can use to gain real-time visibility into your application.
You essentially get an overview of how your applications are performing and what issues are plaguing them. Your team can rely on Atatus’s performance monitoring capabilities to accurately diagnose and fix issues across your entire DevOps stack.
Another standout feature that Atatus offers is real-user monitoring. This allows you to monitor the experience of your users across devices, applications, and countries. You are provided with intuitive RUM metrics, which you can use to effectively address the issue. Atatus is also great at monitoring the health of servers and processes.
With real-time insights and metrics on the health of your servers, you can fix server issues before they can do any serious harm. Like the best LogicMonitor competitors on this list, Atatus is easy to install. All you have to do is install its agent without any code changes.
Features:
- Application Performance Monitoring: Atatus brings all apps within your infrastructure under a single dashboard. You’ll be able to proactively monitor, assess, and fix any performance-related issues affecting them. You are guaranteed full-stack real-time visibility.
- Real User Monitoring: You are granted complete visibility into the end-user experience of apps, especially about browser performance. This includes Core Web Vitals. The tool can help you identify the root cause of performance issues, like slow load times.
- Infrastructure Monitoring: Infrastructure monitoring is simple in Atatus, thanks to the central dashboard. You get complete visibility into performing your infrastructure. The tool can visualize metrics concerning your system with minimal maintenance.
- Synthetic Monitoring: Atatus’s dashboard makes it easier to detect issues plaguing your API over TCP, DNS, HTTP, etc. This way, you are immediately alerted if an app has slowed or broken down. You can count on the tool to ensure high availability and uptime across endpoints.
- Log Management: Atatus is great at searching, filtering, aggregating, and analyzing all your logs at any scale. The software facilitates real-time log monitoring. The tool can consolidate logs from multiple sources along APM traces so it is easier for you to troubleshoot your app logs.
Why I like it:
Atatus is amazing at its core capabilities. However, it wins you over more with its reliable support, real-time insights, and intuitive UI.
Pros:
- Easy installation, no code changes required
- Excellent customer support
- The UI
- Real-time insights
Cons:
- Some users have complained about the resources and documentation being insufficient.
Our Review: Atatus is a great all-in-one monitoring tool I would recommend for application performance, real-user, and synthetic monitoring. It is easy to install and earns a spot on this list for its user-friendly central dashboard, real-time metrics, and excellent customer support.
Price: Atatus offers the following subscription plan:
- APM: Starts at $0.07/host hour per month
- RUM: Starts at $1.96 for 10K views/month
- Infra: Starts at $0.021/host hour per month
- Log: $2 per GB per month
- Synthetic: $1.5 per 10k Check Runs/month
- Analytics: $1 per 10k events/month
A free demo and a 14-day free trial is available upon request.
Website: https://www.atatus.com/
#7) Auvik
Best for network visibility and out-of-the-box alerts.
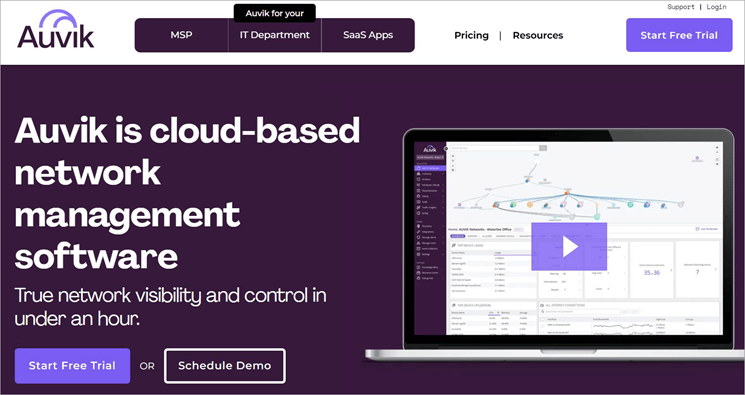
Auvik is one of those LogicMonitor alternatives that caters to MSPs as well as IT departments. Everything you expect from some of LogicMonitor’s best competitors is something Auvik delivers in spades. Let’s start with network visibility. Auvik promises true network visibility and control.
The tool grants you complete end-to-end visibility into your network in real-time. The enhanced visibility also ensures you have greater control over all elements in your network. Auvik also serves as the ideal answer to reactive troubleshooting. It arms users with over 50 out-of-the-box alerts. This allows your IT teams to find and fix errors or issues before it is too late.
Auvik grants you visibility into the exact device or port that is causing issues on your network and troubleshoots it proactively. The tool can also make client onboarding seamless by offering detailed inventory lists and full network diagrams.
Maintaining network compliance is also quite simple and hassle-free with Auvik. Network documentation is centralized by this tool, thus ensuring higher efficiency in maintaining network compliance.
Features:
- Network Visibility and Documentation: Auvik grants you complete network visibility and control. You’ll know everything active on your network in real time. Auvik is excellent at network mapping and discovery.
- Hardware Lifecycle Data: You can rely on Auvik to identify devices on your network that need to be upgraded or replaced. The tool pulls data from supported devices and shows you whether they are on current or expired support contracts.
- Inventory Monitoring: Auvik captures all details related to a device using a network protocol. It will tell you what the device’s model is, where it is located, the IP address, and other key information. Its inventory monitoring capabilities are adequately automated.
- Alert Overlay: Detecting and responding to issues is simple, thanks to Auvik’s alerting system. Alerts appear directly on top of the affected device on the interface. To learn more about the alert details, all you have to do is click on the prompt.
- Connection Information: You can rely on Auvik’s network map to find out how each device is connected. The map shows both physical and logical connections. You can learn these details by simply hovering over the line connecting devices on the map.
Why I like it:
Auvik is great at visualizing data. You are also provided with 50+ out-of-the-box alerts, which you can put to use to address issues before it is too late.
Pros:
- 50+ out-of-the-box alerts
- Network mapping
- Quick issue detection and fix
- Automate documentation
Cons:
- A steep learning curve is involved.
Our Review: Auvik wins you over with its powerful and efficient network monitoring capabilities. The tool stands out for its near-perfect alerting system, which lets you find and fix issues quickly. The tool goes above and beyond to make network management as simple as possible.
Price: You’ll need to contact the Auvik team for a custom quote. A 14-day free trial and a free demo are offered upon request.
Website: https://www.auvik.com/
#8) Zabbix
Best for unlimited scalability.
As expected from some of the best LogicMonitor competitors on this list, Zabbix too excels at full-stack IT infrastructure monitoring. Once launched, the tool will consolidate data related to your entire IT infrastructure stack and present it under a single pane of glass. The tool will collect metrics from any source on your network.
Zabbix is also great at identifying problems by assessing the incoming flow of metrics automatically. Besides helping you define problem thresholds, Zabbix can also address a detected issue proactively. The tool also relies on baseline monitoring to detect anomalies.
For instance, Zabbix analyzes historical data in real-time to accurately identify anomalies plaguing devices or servers on your network.
Features:
- Data Collection and Metrics: Zabbix gathers data from multiple sources across your entire IT infrastructure stack. It accurately detects issues by analyzing this incoming flow of data. The tool alerts users via email, SMS, and other communication platforms as soon as an issue is detected.
- Agentless Monitoring: Zabbix supports a wide range of protocols to facilitate seamless remote monitoring. The tool’s capabilities are easy to extend using external scripts and plugins. You can count on the tool for web, ODBC, and synthetic monitoring.
- Widget–Based Dashboard: Zabbix presents users with the option of visualizing their IT environment. The dashboard itself is very easy to customize. You can create map hierarchy trees and even clone an entire dashboard.
- Root-Cause Analysis: Zabbix can improve your problem-tracking capabilities with the help of advanced root-cause analysis. This analysis can help fix many existing problems while also preventing a flood of secondary issues. You also have the option to close any incoming problem if the root cause has not been addressed yet.
- SLA Monitoring: The tool allows you to use custom SLA calculation logic to define services and their components. SLA calculations are performed by assessing the status of related services. You can get an overview of your service SLAs on a daily, weekly, or monthly basis.
Why I like it:
The central dashboard makes the tool easy to comprehend for users. Plus, the tool is quite effective at detecting errors and anomalies using machine-learning-based tech.
Pros:
- Central dashboard
- Seamless deployment
- Excellent at problem detection and alerting
- Enterprise-grade security
Cons:
- Some users have complained about the steep learning curve initially.
Our Review: In essence, I would consider Zabbix to be a worthy addition to this list. It is excellent as an IT stack monitoring tool and excels at accurately detecting problems and analytics. Its alerting system is flawless while its reporting is comprehensive.
Price: Contact the Zabbix team for a custom quote. A free demo is available upon request.
Website: https://www.zabbix.com/
#9) Datadog HQ
Best for deep visibility and cloud security.
Easy to deploy and use, Datadog HQ is another tool that can easily go toe-to-toe with LogicMonitor in terms of performance. You are immediately granted deep visibility into your infrastructure’s performance as soon as the tool is launched.
The tool arms engineering teams with data visualizations, metrics, and the alerting system they need to optimize cloud and hybrid environments.
Seamless deployment is perhaps the tool’s strongest feature. Datadog can be deployed anywhere and can analyze the most complex of infrastructures with the help of tag-based search and analytics.
Its problem-detection capabilities are also fantastic, thanks to the tool’s use of advanced machine-learning technology.
Features:
- Stack Monitoring: Datadog stands out for the simplicity with which it facilitates monitoring. The tool features an intuitive interface that can be used without any query language. Datadog’s use of machine-learning-based tools also makes it easier to accurately detect issues.
- Deep Visibility: The tool arms you with thousands of out-of-the-box infrastructure metrics. You’ll get to see continuous historical records. You can troubleshoot issues at an exceptional pace with a one-click correlation of traces, logs, metrics, and security signals.
- Metrics Assessment: The tool makes it easier to ingest and assess metrics. You get to decide which metrics to index for your query. The metrics are ingested while preserving mathematical accuracy and granularity.
- Cloud Infrastructure Security: The software is exceptional at helping you ensure the security of your cloud infrastructure. It performs continuous configuration checks across your hosts and cloud accounts to enhance your security posture. The software depends on out-of-the-box support to track audit requirements.
- Data Collection: The tool is quite advanced in data collection. It can help you access globally accurate percentiles. Thanks to the tool’s Live Process Monitoring capabilities, you’ll be able to track the impact of every process running in the stack.
Why I Like It:
As far as monitoring tools go, Datadog HQ ensures it is easy to use with an intuitive and user-friendly interface. The deeper visibility and continuous monitoring ensure no error goes unnoticed. Its analytical capabilities are some of the best I’ve experienced.
Pros:
- Real-time monitoring
- Easy to use
- Exceptional analytical capabilities
- A free plan for infrastructure monitoring is available.
Cons:
- Caters heavily to advanced users like data scientists and engineers.
Our Review: There is a lot to like about Datadog HQ. It features an easy-to-use interface, arms you with deep security insights, and its deployment process is quite simple. If you are looking for a tool that can dissect complex infrastructures with precision, then give this tool a try.
Price: Datadog HQ offers the following plans:
- Infrastructure: starts at $15/host per month
- Application performance monitoring: Starts at $31 per host per month.
A free plan is available. A free demo and trial are also available upon request.
Website: https://www.datadoghq.com/product/infrastructure-monitoring/
#10) Dynatrace
Best for AI-powered automation.

With Dynatrace, you get an infrastructure observability tool that’s powered by an advanced and intelligent AI. This advanced AI automates several crucial aspects associated with infrastructure monitoring and problem detection. You can rely on the tool for end-to-end visibility in modern cloud environments.
Besides infrastructure monitoring, the tool is also great at application performance monitoring. You can rely on the tool to monitor the performance of your apps, regardless of where they are located. The software facilitates profiling for cloud-native and enterprise stacks.
The tool stands on two feet because of the automation it facilitates, which is largely driven by strong security and observability insights.
Features:
- End-to-End visibility: Dynatrace ensures enhanced end-to-end visibility into your entire IT stack, thanks to the AI powering it. The tool facilitates continuous discovery and visualization of dynamic environments. This includes the discovery of hosts, networks, and services.
- AI-Driven Insights: Dynatrace features a robust AI called Davis. This AI keeps false positives at bay and ensures only accurate issues are identified. You can rely on this AI to continuously monitor cloud platforms and infrastructure.
- Automated Context: With automated context and causation, Dynatrace can save your IT team hours. It automatically retains the context of ingested data to offer powerful analytics. You can rely on the tool to replace error-prone tagging across your entire IT stack.
- Automate Remediation: The tool is backed by the powerful AutomationEngine. It can easily integrate with many prominent incident remediation and automation tools. These integrations help the tool perform auto-remediation, auto-ticketing, and real-time CMDB updates.
- Real-Time Analytics: Dynatrace offers accurate real-time insights. The insights provided are on budget and at scale. You get monitoring and security analytics in context with no schemas.
Pros:
- The Davis AI
- Real-time insights
- Advanced threat protection
- Enterprise-grade customization
Cons:
- Not suitable for novice users.
Our Review: Dynatrace carves itself a spot on my list, largely because of the AI powering its monitoring and security capabilities. This is a software I would recommend for automated application performance monitoring and infrastructure observability.
Price: Infrastructure monitoring will cost you $0.04 per hour for any size host. The full stack monitoring plan will cost you $0.08 per hour for an 8GB host.
Website: https://www.dynatrace.com/
#11) Sumo Logic
Best for quick issue troubleshooting.

Like the tools before it, Sumo Logic also lets you monitor your entire infrastructure in both cloud and hybrid environments. The tool is exceptional at troubleshooting issues. You can rely on Sumo Logic to monitor devices and apps on your network, detect issues, and take measures to fix them on scale.
The tool also guarantees enhanced cloud infrastructure security. Any identified risk, no matter where it is located on the network, is consolidated and comprehensively presented to you. You can also ensure robust compliance with Sumo Logic. The tool will make sure that all data collected is safe and compliant across all on-premises and cloud environments.
Features:
- Database Monitoring: The tool presents you with KPIs related to the performance of your database. You get complete visibility into the performance, health, and behavior of your databases.
- Kubernetes Monitoring: The tool features a robust Kubernetes monitoring app. This app comes with built-in server monitoring and troubleshooting capabilities. It also features a security dashboard.
- AWS Monitoring: Sumo Logic facilitates deep AWS integrations. You can leverage these integrations to get unified visibility over all AWS services. The tool also helps you perform quick troubleshoots across EC2, ECS, SNS, SQS, etc.
- Azure Monitoring: You can rely on the tool to gain visibility into your entire Azure stack. Accessing the stack becomes further simpler with the help of out-of-the-box dashboards. Sumo Logic supports a plethora of Azure apps and tools.
- OpenTelemetry: With OpenTelemetry, Sumo Logic helps you isolate and fix issues before it is too late. It lets you collect data on infrastructure in all forms. You are provided with OOTB configurations for over 25 sources.
Pros:
- Flexible pricing
- Data-driven insights
- Gain visibility into Azure, AWS, and GCP environments.
Cons:
- Some users have complained about scaling when performing root cause analysis.
Our Review: Sumo Logic is quite impressive when it comes to infrastructure monitoring, application observability, and log analytics. Its ability to automate 360-degree visibility across your cloud environments alone makes the tool worth checking out.
Price: Contact the Sumo Logic team for a custom quote. A free plan is also available. A 30-day free trial and demo is also offered upon request.
Website: https://www.sumologic.com/
#12) IBM Instana
Best for automatic network discovery and mapping.

IBM is perhaps the most familiar name on this list. Over the years, the company has graced us with robust solutions and Instana doesn’t disappoint. What you get is a tool that can efficiently monitor your network, map it, and discover issues facing it in real time.
You are guaranteed complete visibility across your entire stack. IBM Instana is constantly at work once launched. It continuously monitors your environment to capture all traces without fail. The app can detect any changes in real time. You are also provided with detailed insights into the issues detected.
Features:
- Full Stack Observability: You get end-to-end visibility into your entire application stack. The tool can quickly identify and fix issues. You are provided with high-fidelity data in real-time.
- Performance Optimization: The tool facilitates cloud-native optimization. It automates root cause detection and automatically detects change as well. The tool helps engineers and data scientists manage change, regardless of how rapid it is.
- Incident Remediation: You can expect accelerated incident detection and remediation with Instana. The tool utilizes causal AI analysis to accurately identify problems. You are recommended actions that could solve the issue faster.
- User Experience Monitoring: The tool can help you monitor real user experiences remotely. You gain end-to-end visibility into each user’s journey of using an app. As such, you can optimize user experiences across endpoints.
- Gen-AI Performance Monitoring: The tool can be used for enhanced monitoring across multiple AI-powered environments. It will proactively address issues that gen-AI IT solutions are facing and optimize their efficiency in the process.
Pros:
- Built-in automation
- Transparent pricing
- AI-powered intelligent actions
Cons:
- Instana is mostly meant for advanced users.
Our Review: Instana is yet another excellent addition to IBM’s ever-expanding family of software solutions. It stands out for its built-in automation and powerful AI that can remediate most issues without hassle. This is a great app for users who wish to manage their app’s performance across their network in real-time.
Price: Contact the IBM team for a custom quote. A free trial and demo are available upon request.
Website: https://www.ibm.com/products/instana
Frequently Asked Questions
-
What are the alternatives to LogicMonitor?
While LogicMonitor is a great monitoring tool, it is one of many possibilities. There are tools out there that can deliver what LogicMonitor promises and even outperform it in certain areas. Some of the best alternatives to LogicMonitor today are Paessler PRTG, Sematext, Logit.IO, and Atatus.
-
Is LogicMonitor a SaaS company?
Yes, LogicMonitor is a SaaS company. The tool is best known for being a great SaaS application monitoring tool. You can count on the software to get deeper insights into the health and performance of various applications, such as Office 365, Slack, etc., on your network.
-
Does LogicMonitor use agents?
LogicMonitor is perhaps best known for its agentless architecture. This agentless architecture helps the tool facilitate comprehensive monitoring across hybrid environments. The absence of agents works in the tool’s favor: LogicMonitor’s deployment is fairly seamless and the impact on your infrastructure is negligible.
-
Is LogicMonitor an APM?
LogicMonitor is exceptional at application performance monitoring. The tool immediately grants you end-to-end visibility into the performance of your applications, regardless of where on your network they are located. You can rely on the tool to track user performance and identify bottlenecks affecting modern applications across multi-cloud and hybrid environments.
The tool is good at resolving complex application-related issues with end-to-end tracing. It also helps that the tool is built completely on OpenTelemetry and OpenMetrics standards. You can use the tool to strengthen the resiliency of modern apps. -
Who owns LogicMonitor?
LogicMonitor is owned by Vista Equity Partners who acquired a majority stake in LogicMonitor. Vista Equity Partners is known for being a private equity firm that owns Datto.
Conclusion
LogicMonitor has been a go-to software for network monitoring for years now. Its SaaS-based automated monitoring is impressive. You’ll be able to deploy it in minutes. It is also powered by an intelligent AI and comes loaded with advanced features. Despite its many merits, LogicMonitor isn’t perfect.
Those seeking an on-premises tool with extensive monitoring capabilities will be disappointed. Fortunately, it isn’t the software in the market that promises excellent infrastructure and application monitoring. You are going to find tools on this list that are more than makeup for the shortcomings of LogicMonitor.
As for my recommendation, I’d recommend Paessler PRTG for its intuitive UI, seamless deployment, and pre-configured sensors. The software is affordable and does its job with impeccable finesse.
Research Process:
- I spent 20 hours researching and writing this article so you can have summarized and insightful information on which LogicMonitor competitors will serve you best.
- Total alternatives researched: 21
- Total tools shortlisted: 11


