Discover the top SolarWinds NPM Competitors that outshine in features and reliability. Pick the right SolarWinds NPM alternative of your choice to elevate network performance monitoring to new heights:
SolarWinds Network Performance Monitor is a popular network monitoring software on the SolarWinds platform. It monitors uptime status, performance metrics, and other aspects of a network connection to help reduce downtime.
For each performance issue identified, the user can leverage detailed interface metrics to identify the root cause of the problem. The tool includes other capabilities, including capacity forecasting, alerting, and reporting.
Table of Contents:
SolarWinds Network Monitoring Software: Top Replacements
The SolarWinds software monitors cloud, hybrid, and on-premises environments. It can quickly identify, notify, and troubleshoot network systems, devices, services, and resources when issues arise. This can range anywhere from server failures, network outages, power outages, and application errors to user surges or spikes, storage failures, and human errors.
Based on user reviews and expert analyses, this tutorial investigates competitors for or alternatives to the SolarWinds NPM.
=> Visit SolarWinds NPM Website
Here is a video tutorial for your reference:
How Network Monitoring Software Works
Network monitoring software collects data from already existing or separately installed agents on operating systems or environments and analyzes the data to deliver reports and send alerts about network and network device status, availability, and performance.
These alerts, along with the resulting information generated on dashboards, are used to determine the root causes of issues and help guide action to resolve the issue. In some cases, network monitoring tools can even attempt corrections.
Engineers and network administrators use network monitoring applications to troubleshoot network outages and failures, which they identify through trend analysis. Trend analysis is a technique used to decipher patterns from collected data and derive conclusions regarding the optimal performance of the device network and other resources.
Network monitoring helps companies in various ways:
- Cost and user experience optimization
- Faster troubleshooting and downtime resolution
- Compliance requirements oversight
- Device and network security improvement
- Increased network and device efficiency
There are many types of network monitoring, such as performance monitoring, availability monitoring, configuration monitoring to detect misconfiguration and related issues, and cloud monitoring tools.
The network protocols used can vary, but you often find Simple Network Management Protocols (SNMP) monitoring network performance on bandwidth utilization, interface status, latency, and CPU usage.
This protocol exchanges and extracts information that passes between network devices, such as routers and switches. The Internet Control Message Point (ICMP) is used to report errors and unavailability of a given service or host.
Market Trends in Network Monitoring
- The global network monitoring market size is expected to grow at a CAGR rate of 9.7% between 2024 and 2028 (from $2.91 billion to $4.21 billion in 2028) according to research-based projections by The Business Research Company.
- The above increase in market size is because of several factors, the first being the rise in cloud-based network deployments. Cloud-based deployments are more flexible, easier to deploy and manage, and less resource-intensive compared to on-premises and hybrid solutions. SaaS and cloud-based solutions will continue to propel this growth in market size.
- Other equally important factors are due to the growing importance of application performance monitoring or APM; increased integrations with AI and machine learning; the emergence of edge computing; and as usual, an increased focus on network automation and orchestration.
- There is a focus on hybrid and multi-cloud network monitoring solutions, collaborations with network security solutions, integration of 5G capabilities in network monitoring solutions, and compliance with data privacy regulations. Real-time remote network monitoring is also a major focus area for innovators, according to the report.
- Although the North American region had the largest market share in the forecasted period mentioned above, Asia-Pacific is expected to be the fastest-growing network monitoring market.
SolarWinds: Prominent Features
[image source]
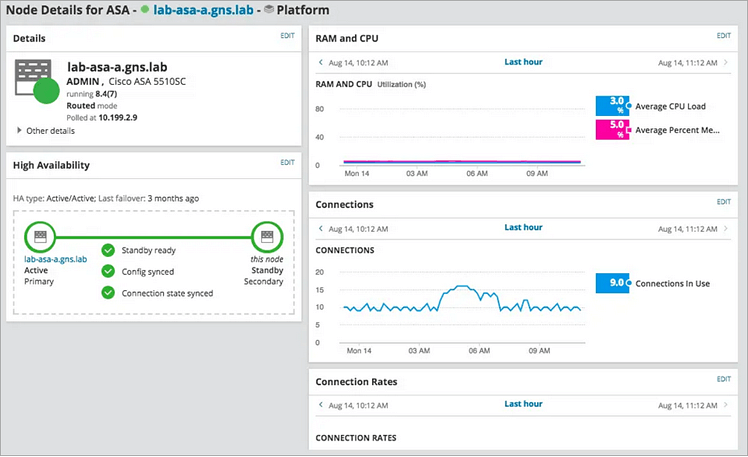
#1) Network Performance Visualization: SolarWinds NPM NetPath provides visual performance, traffic, and configuration data of what is happening within and around your network. The software provides device/interface/network/node availability and real-time and historical statistics (SNMP, API, or WMI-enabled devices).
Users can get data on traffic history, packet loss over time, etc. The “Nodes with Problem” widget shows as red on a node that is out of service or as gray when the status is unknown. Other widgets can provide detailed information on the performance issues identified, to aid in troubleshooting.
With NetPath, users can identify issues relating to network slowdown before a failure. NetPath also comprises the Network Configuration Manager, which users can utilize to visualize configuration details of their devices, and the Network Traffic Analyzer for visualizing traffic.
#2) Intelligent Alerts: The tool lets you customize alerts based on your needs. You can define which conditions trigger alerts and specify when, how, and to whom an alert will be sent. Users can also receive notifications when there are changes to a network and remove unnecessary alerts to focus on the most critical ones.
This is in addition to receiving alerts regarding response time delays, high memory usage, device outages, server crashes, server overloading, failure on routers and other system devices, etc.
#3) Custom Reports for each Network Node: Users can create reports on node availability for a given node. This is done using the NPM’s Layout Builder feature. Reports help identify issues on the network.
#4) Pricing: SolarWinds offers a 30-day free trial. There are two licensing options, Subscription and Perpetual. The price for Subscription starts at $1856 and for Perpetual starts at $3592.
#5) Community: There is also an active community that provides several tips and tricks on tool usage.
Why look for SolarWinds Alternatives?
- Pricing versus features and functionality issues: Some tools offer better scalability, better integration options, better customizability, and certainly, more features than SolarWinds.
- Data safety and security: Data security issues with SolarWinds’ Orion architecture in 2020 resulted in the hacking of data for 18,000 SolarWinds customers, including several federal government networks using the Microsoft 365 platform.
List of the Best SolarWinds NPM Competitors
Select from these popular alternatives:
- Paessler PRTG
- Site24x7
- ManageEngine OpManager
- Obkio
- Netreo
- Zabbix
- Datadog
- Nagios
- New Relic
- Dynatrace
- Auvik
Comparing the Top SolarWinds NPM Alternatives
| Name of NPM | Operating systems support | Configuration | Environments | Data retention | Pricing |
|---|---|---|---|---|---|
| SolarWinds NPM | Windows | Deploy all agents from Orion platform. Easy. | On-premises, cloud, and hybrid. | Detailed data for 7 days, hourly data for 30 days, daily data for 360 days. | $39, $79, $99 per technician per month |
| Paessler PRTG | Windows. Other interfaces include macOS and Linux support, as well phone applications. | 200+ preconfigured sensors, custom sensors, and HTTP APIs. Easy. | On-premises, cloud, and hybrid. | Historic sensor data, is 365 days by default, with the option to increase up to 9999 days. Other data is limited to 30 days. | It starts at $1934,10 for [License Size: 500 + 12 months maintenance] |
| Site24x7 | Android, iOS, Windows, and Linux | -- | Cloud, SaaS and web-based | -- | Starts with $9 per month. |
| Obkio | Windows, Linux, VMWare, Hyper-V, Web and mobile app (IOS & Android). | APIs and agent-based . | Cloud | Starter & Basic plans retain 6 months; other plans retain up to 36 months. | $199, $399, $699, or $2,000 per month. |
| Netreo | Windows, Linux, Unix, Solaris, and OS/400 and Z/OS. | APIs and third-party integrations. Can be complex to adapt. | Cloud, on-premises, and hybrid | 7 days, 100 days, 196 days, to 3 years depending on granularity. | $6 per resource per month; custom pricing available. |
| Zabbix | Linux, Windows. | Complex. Templates, API, Add-ons available. | Cloud, on-premises, and hybrid. | Custom. | Free and open source. Technical support can be purchased. |
Solarwinds NPM Competitors or Alternatives Analysis
#1) Paessler PRTG
Best for using pre-configured sensors for monitoring network devices and resources, as well as monitoring networks across different operating systems.

While SolarWinds comprises individual modules where the customer must choose several of those modules to access the full range of services, Paessler PRTG is an all-in-one tool that provides access to the full range of features on a single module.
Because the tools are isolated on SolarWinds, the latter may turn out more expensive and take more time to set up.
In addition, PRTG requires one computer to act as a core server and uses its database that is tested in-house. On the other hand, SolarWinds requires a SQL server, leading to a higher cost and more time necessary to configure the software.
Remote probes can be installed on PRTG to extend its monitoring capabilities. These are equivalent to polling engines on SolarWinds–an additional polling engine on the latter costs $20,000, whereas a PRTG license includes an unlimited number of probes.
PRTG is used for monitoring local network bandwidth and traffic, websites and app statistics, databases (by configuring PRTG sensors and SQL queries), virtual environments, storage systems, servers, VOIP services, remote cloud services, CCTV systems, industrial environments, and more.
Operating Systems: Windows. The desktop application and remote probes also support macOS and Linux. There is also an IOS and Android phone app.
Features:
- 200+ pre-configured sensors for monitoring devices (such as servers, routers, switches, etc) from all major manufacturers such as Cisco, HP, Dell, AWS, Windows, VMWare, NetApp, Citrix, Exchange, Apache, Oracle, IBM, Synology. Also includes Google Drive, OneDrive, Office 365, Salesforce, and Dropbox.
- HTTP API: Users can manipulate monitoring objects using HTTP requests.
- Users can customize their monitoring solution via custom sensors. For example, with the REST Custom sensor, users can monitor everything that provides data in XML or JSON formats.
- Automated network and device discovery during initial installation processes. Also, users can run regular and scheduled discoveries.
- Autodiscover and network mapping services, SNMP device monitoring, traffic monitoring, and ping-based availability checks.
Pros:
- Strong customized monitoring.
- Lower cost for access to all features when compared to SolarWinds. No hidden costs and no extra packages to buy.
- Use across diverse operating systems.
Cons:
- Limited sensor allocations.
Pricing: Paessler offers a free trial for both the on-premises and cloud solutions. Subscription plans are:
| License size | Wholesale Price |
| 500 + 12 months maintenance | $1934,10 |
| 1000 + 12 months maintenance | $3509.10 |
| 2500 + 12 months maintenance | $7289.10 |
| 5000 + 12 months maintenance | $12779.10 |
| XL1 + 12 months maintenance | $16109.10 |
#2) Site24x7
Best for All-in-one monitoring from one console.

Site24x7 is one of the best alternatives of SolarWinds as it is a lightweight and nonintrusive agent, and provides all-in-one monitoring for websites, servers, applications, networks, and cloud services from a single console. It offers flexible pricing plans so that it would be easy for its users to scale as per the requirements.
There are many features that are present in Site24x7 and not in SolarWinds like Meraki map view, cluster messages based on pattern similarity, security monitoring, monitoring & managing JavaScript errors, and terrafirm support.
Operating system: Android, iOS, Windows, and Linux.
Features:
- Can be scaled per the needs of the business with its flexible pricing plans.
- Lightweights and non intrusive in nature. Runs with minimal support.
- Monitors various aspects of the infrastructure from a single console.
- Trusted by clients like NASA, GoDaddy, SAP, Ford and more.
Pros:
- Comprehensive monitoring.
- Collects data for the source automatically.
- Lightweight and non intrusive agent.
- Monitoring of multiple components from a single console.
- Custom SNMP monitoring.
Cons:
- Overalerting on larger outages.
- Complex setup.
Pricing:
- All-in-one pricing plans are as:
- Pro- $35 per month.
- Classic- $89 per month.
- Enterprise- $225 per month.
- A 30-day free trial is available.
#3) ManageEngine OpManager
Best for small business to large businesses based on the affordability

ManageEngine OpManager is an on-premises network monitoring application that is more affordable but lacks advanced features compared to competitors like SolarWinds.
The standard and professional packages can monitor up to 25 devices for just $245 and $345 respectively, although most small to midsize organizations monitor at least 50 devices – a package that monitors 250 devices costs $11,095 for a one-time license.
ManageEngine, however, offers a free edition with which clients can monitor up to three devices on ManageEngine’s website, in addition to the 30-day free trial for the standard package.
Operating Systems: Windows Server, Linux server, and Web-based browsers
Features:
- Custom design maps with drag-and-drop tools in the manner of Microsoft Visio.
- Device auto-discovery by way of creating a Discovery Channel. Users also can add a device under the Inventory tab.
- Auto-generation and updating of network topology maps.
- SSH, SQL, and Postgres support. The application is based on Java.
- Virtualization is supported. You can monitor any virtual machines and virtual networks under the Virtual Details tab. The “Virtual environment discover” feature is supported on the Professional and Enterprise editions.
- Custom criteria for alerts and notifications in addition to multiple methods of sending notifications.
- Multiple add-ons can be added including the Applications Manager plug-in which brings Reports into the app. A REST API is provided, with which developers can create custom plugins with diverse languages.
- In addition to SNMP, ManageEngine also supports hardware, file/folder, VOIP, Syslog, and WAN Link monitoring.
Pros:
- Scalable
- Affordable compared to SolarWinds
- Offers a free edition in addition to a 30-day trial period
Cons:
- Reporting is not in-built but is possible via the Applications Manager plugin. However, it requires Adobe Flash, which is mainly flagged as unsafe. Plugins also do not run internally to the environment but externally for developers who would prefer the former.
- Requires upgrade to Enterprise Edition to monitor devices across multiple networks.
Pricing: Free edition, Standard is $245, Professional is $345, Enterprise is $11,545
Check Our Review of ManageEngine OpManager Alternatives
#4) Obkio
Best for mobile-based monitoring of networks in addition to support for multiple operating systems compared to SolarWinds.
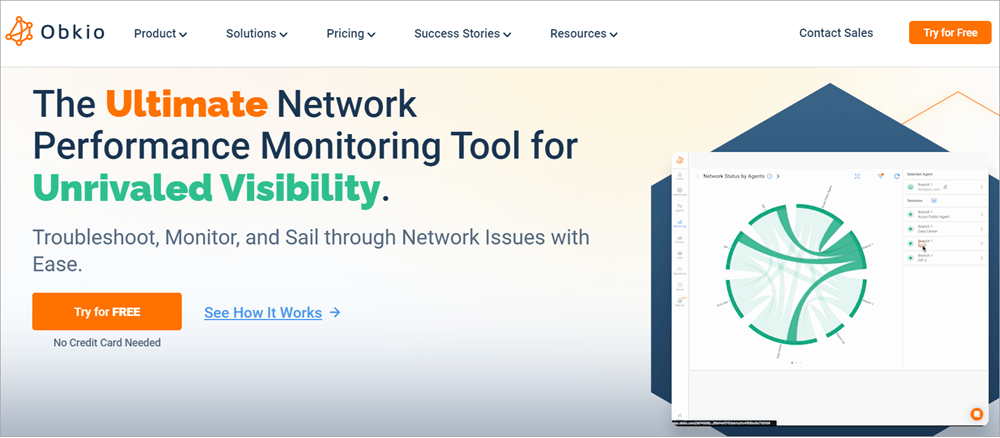
Obkio is a cloud-based monitoring tool used to monitor performance and troubleshoot issues on applications and services (VOIP, LAN, WAN, SD-WAN, VMWare, Distributed Networks, ERP, FWaaS, Hyper-V, Hardware, MPLS, SaaS, Cloud, SASE, VPN, Internet, and UC) as well as boost the user experience for these services.
The software presents a dashboard that displays the agent reports of all sites and their statuses. Naturally, an agent must be installed for each host or network to be monitored. There are four types of agents:
- Software installed on-premises and which runs on Windows, Linux, Docker, Hyper-V, VMWare, or Oracle Virtualbox
- Public cloud platforms for which Obkio has written agents (including AWS, Azure, and Google Cloud Platform)
- Virtual appliance versions installed on-premises
- Plug-and-play hardware agents that run on a device shipped to the user by Obkio
Watch this video for further details.
Operating Systems: Windows, Linux, VMWare, Hyper-V, Web, and mobile app (IOS & Android).
Features:
- Historical data retention for ping feedback.
- Ping performance tests.
- Various monitoring tools: network latency, mean opinion score, network jitter, network monitoring and troubleshooting, network speed, and throughput.
Pros:
- Cloud-based, hence no need to install software and quick deployment.
- Free version and free trial for 14 days.
- More affordable when compared to SolarWinds.
- Traceroute analysis.
- Support for multiple operating systems compared to SolarWinds.
Cons:
- No network auto-discovery; no network inventory; and no network topology maps, unlike those provided on other similar software.
- Device performance monitoring is based on ping and not on SNMP.
- No support for traffic reporting, device configuration assessment, monitoring of wireless networks, and virtualization tracking, which are available on SolarWinds.
Pricing: Obkio offers a 14-day free trial. The difference in plans is based on the number of agents and devices supported, as well as the data retention period.
- Starter plan: $199 / month for business plans
- Basic: $399 per month
- Premium: $699 per month
- Enterprise: Starts at $2,000 per month
Website: https://obkio.com
#5) Netreo
Best for network monitoring in multiple environments, namely cloud, on-premises, and hybrid environments, as well as on multiple operating systems.
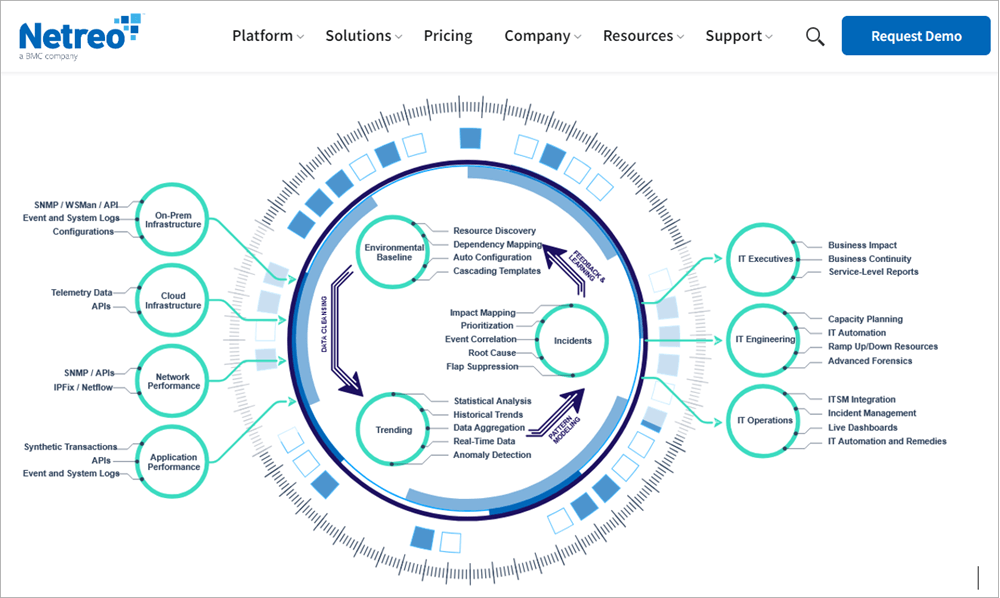
Netreo SaaS and on-premises solution support manual and automated network monitoring – the latter leverages industry best practices and historical data. Through automation, customers can eliminate redundant tasks and repeat problems, as well as optimize system performance. The system can also deliver automation suggestions for how users can optimize infrastructure.
This SolarWinds NPM Competitor can monitor networks, infrastructure, servers, virtual machines, cloud services, apps, configured networks, traffic, storage, user experience, databases, SD-WAN, and synthetic monitoring.
Operating Systems: Windows, Linux, Unix, Solaris, and OS/400 and Z/OS.
Features:
- Users can view all assets from a single unified dashboard.
- Artificial intelligence for IT Operations (AIOps) capability. The tool automatically gathers and uses data to analyze situations, detect and resolve issues, and optimize performance.
- Smart alerting and incident management, including retesting failed services to suppress false alarms, application failure detection, and automated issue resolution. The tool also alerts users before a major performance incident can happen.
- Network monitoring on iOS and Android apps.
- User and application-level network monitoring, reporting with pre-built customizable reports, and analytics. In-depth network analytics to optimize performance.
- Third-party integrations, e.g. with ServiceNow, Amazon, and Azure. Popular databases such as SQL, Oracle, MariaDB, and MySQL; firewalls (e.g. Cisco, FireEye, Juniper SonicWall, etc.); SD-WAN platforms such as Vecloud, Cisco Meraki, Silverpeak, etc.; and Jira.
Pros:
- Live and on-demand webinars, white papers, and eBooks can guide users and provide more details on the software, besides a custom product demo. Netreo also provides support services such as training and onboarding.
- The monitoring tool can handle network monitoring across multiple environments, namely cloud, on-premise, and hybrid. It also handles monitoring on more operating systems than SolarWinds and most other platforms on this list.
- It leverages existing manufacturer APIs to collect data from various devices and services instead of having to install additional agents for analysis and monitoring purposes.
- 3 years of data retention for daily statistics and 90 days of data retention for detailed statistics.
Cons:
- Technical expertise may be needed for optimal use. Users would need a detailed configuration to make it suit certain IT environments.
Pricing: Professional starts at $6 per resource per month, billed annually. The ultimate plan offers customized pricing.
Website: https://netreo.com
#6) Zabbix
Best for free network monitoring, open-source monitoring, scalability, and template-based configuring of networks, applications, and end-points
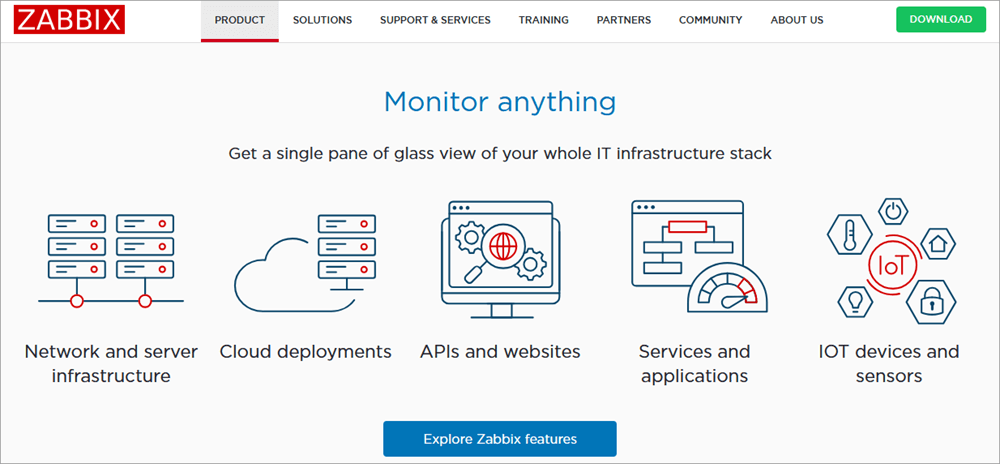
Zabbix open-source is used to monitor servers, applications, and services where users can leverage real-time metrics and instant alerts to make decisions on how to optimize system performance.
The most compelling features include advanced analytics, robust customization, and high scalability, making it suitable for varying network sizes, environments, growth rates, and configurations.
It also features automatic network detection and configuration and automatic report generation. Clients also can automate certain functions such as server monitoring.
However, unlike SolarWinds, it may not be the best option for those seeking more user-friendly interfaces, easy installation processes, and quick solutions. It is, however, more affordable and offers better customization and scalability options.
Operating Systems: Linux, Windows
Features:
- Community-created templates for use when configuring networks, applications, and end-points for monitoring.
- API access and several add-ons, which facilitate integration with other tools.
- Performance monitoring.
- Dashboard to oversee and monitor the global health of all resources, which eases and quickens troubleshooting.
Pros:
- Support for extensive features and configurations, although it may mean a stiffer learning curve for users/clients.
Cons:
- Might require expertise to install because of the complexity involved. On-boarding might also be a struggle for many users.
- Resource-intensive.
Pricing: Free and open-source. Technical support can be purchased.
Website: https://www.zabbix.com
#7) Datadog
Best for console-based monitoring agent installations, machine-learning-based network monitoring, and monitoring of Docker, Heroku, etc.
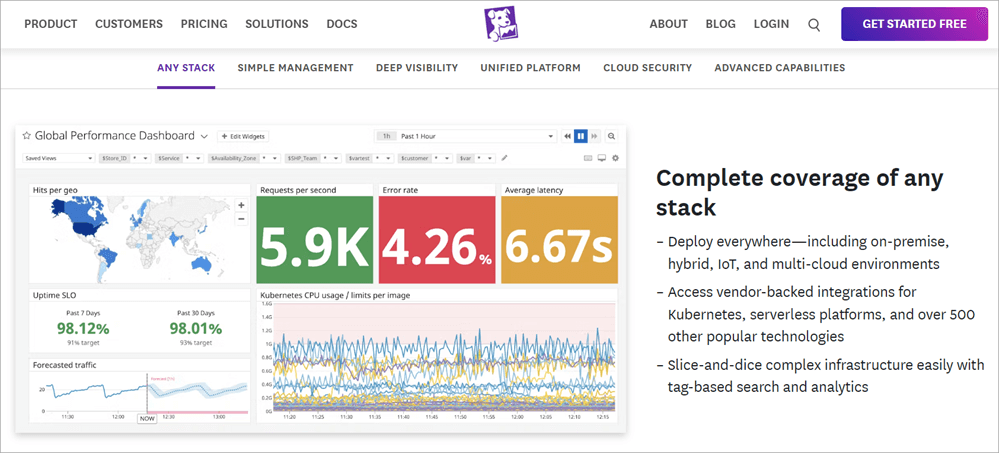
Datadog is used for traffic analysis to highlight malicious behavior and unusual traffic surges, conduct DNS health analysis, monitor and report the communication status between cloud resources and device health, and forecast bandwidth usage.
It is primarily geared at network monitoring and infrastructure management for cloud applications and services but can be used to monitor almost all other applications.
This SolarWinds NPM Competitor can be used to monitor traffic in on-premises servers, cloud apps, and containers. With regard to DNS analyses, it is used to report on the volume of DNS requests, DNS response times, and error codes. The cloud-hosted solution is best for use by mid-sized organizations.
Operating systems: Windows, Linux
Features:
- Automatic device discovery
- Automatic health monitoring of all devices in the network.
- Agent-based architecture.
- 350 API and integration services.
- SNMP, TCP, and Shell protocol support.
- Monitor Docker, Heroku, and other development platforms.
- Widgets that can be added when configuring controls on the dashboard.
- Machine learning to detect system and service anomalies.
- Email alerts
Pros:
- Extensive integration capabilities through the plugins and APIs, especially the web API that can be used with most languages. The latter extends monitoring for custom devices, especially for those who can programming.
- Less resource-intensive since it is SaaS-based.
- Customizable views for each application.
Cons:
- Not primarily for monitoring routers and network hardware.
- No standard reporting.
- Agent-based architecture means the initial installation process can be significant when installing console-process-based agents. You will also need to install an agent on each of your devices.
Pricing: Data Dog offers a 14-day free trial.
- The price for the Network Performance tier, which is best suited for small to mid-size organizations, starts at $5 per function per month.
- The Infrastructure tier, which is best for organizations that want centralized infrastructure monitoring, costs $15 per host per month.
- The APM tier, best for large organizations that want to fix service and device issues, costs $31 per host per month.
- The serverless tier costs $5 per host per month.
- The log Management tier costs $1.27 per million log events per month.
- There are other tiers for security, synthetic, and real user monitoring. Prices are billed annually.
Website: https://datadoghq.com/product/infrastructure-monitoring
#8) Nagios
Best for audit logging, SLA reporting, automated host decommissioning, historical monitor data analyses, etc within network monitoring aspects.

The Nagios Core monitors common network devices and services including HTTP, SMTP, POP3, NNTP, ping, processor loads, and memory and disk utilization. Although it is difficult to configure using configuration files, Nagios can monitor just about anything.
There also are multiple plug-ins provided and accessible via the website, which are compiled as executable scripts.
Nagios XI is the commercial version of the Core edition and provides additional features. It provides real-time monitoring and historical data analysis capabilities. The pricing is based on the number of nodes supported for monitoring.
Platforms: Windows, Linux, and web
- Customers can view and manage infrastructure either from a host and/or a service perspective. Infrastructure also can be organized into groups.
- Configuring of monitoring services is done using configuration files. Types include log, services, hosts, and command configuration files. There are examples of how to configure parameters.
- Users can install agents to monitor particular resources as necessary.
- Custom reporting capabilities.
- Users can add comments related to hosts and services.
- MySQL and PostgreSQL are supported.
- Virtualization is supported.
- The Enterprise Edition supports Audit Logging, SLA Support & Reports, Automated host decommissioning, Server Console Access, Scheduled Pages, SNMP Trap Interface, etc.
Pros:
- Lots of available plug-ins and themes. Most of the 6,000 projects on Nagios are plug-ins, add-ons, and extensions.
Cons:
- The installation has many steps and custom configuration can be daunting. Detailed documentation is, however, available. There also are links on the web interface to resources such as videos, guides, plug-ins, etc.
- Using configuration files can present many problems when managing large and heterogeneous infrastructures.
Pricing: Standard Edition costs between $1,995 for 100 nodes monitoring to $11,995 to monitor 1,000 nodes. It costs $19,995 to monitor an unlimited number of nodes. Enterprise Edition costs $1,500 on top of the Standard Edition version chosen.
Website: https://nagios.com/products/nagios-network-analyzer
#9) New Relic
Best for server-only monitoring at low cost.
New Relic works on-premises and in the cloud and is applied in the monitoring and management of servers at an extremely affordable cost. The fact that it does not extend monitoring support to hardware network devices limits its network monitoring capabilities.
For instance, if a user is interested in monitoring port and switch utilization and network errors at the switch level, they will need to use the API to write plug-ins that can allow monitoring of network devices and other resources.
Operating Systems: Windows server, Linux server.
Features:
- Broad range support of cloud systems from Amazon to IBM to Azure.
- Automated easy installation, although one can use the “Add Host” function to install individual hosts separately.
- 13 months of data retention on the Pro plan; and 3 months on the Essentials plan.
- Syslog, cloud flow logs, and network flow logs are supported.
- Monitoring AI-powered apps as well as mobile apps.
- 750+ integrations: .NET, Node.js, Windows Services, JFrog, Kafka, Amazon CloudFront, Active Directory, etc.
- AI-powered insights on how to improve network performance.
Pros:
- Free plan of 100GB with full access to the platform. No credit card is required. Users can also request a demo.
Cons:
- Does not monitor physical infrastructure such as switches, routers, printers, and other network devices.
- Does not support some major Linux distributions.
- Writing code for the SDK is needed to use the software.
Pricing: New Relic offers the solution with four pricing plans, Free, Standard, Pro, and Enterprise. The free plan allows 100GB per month of data. The standard plan is for small teams that are getting to start with observability. It costs $10 for the first user and $99 per additional user.
Teams with more than five engineers and complex workloads should go with the Pro plan. It will cost $349 per user for annual commitments. With the Enterprise plan, you can get custom pricing based on the advanced security and support requirements.
Website: https://newrelic.com
#10) Dynatrace
Best for AI big data analytics in network monitoring; users prefer cheaper subscriptions for individual separate service monitoring.
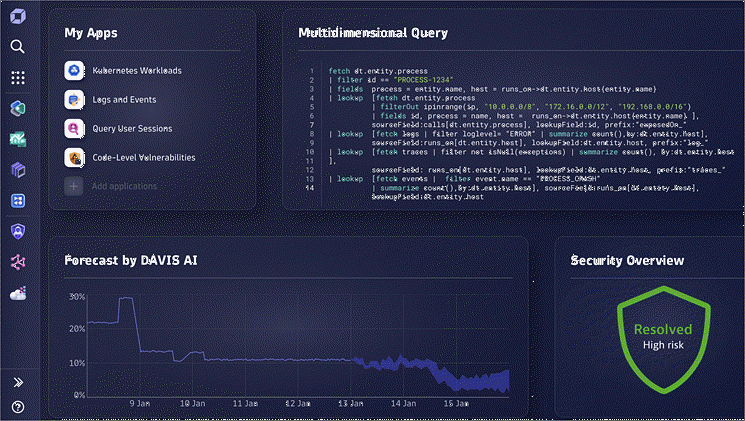
The Dynatrace on-premises and SaaS network monitoring tool is targeted at small, medium, and large businesses. It is capable of container monitoring and cloud monitoring in addition to infrastructure monitoring, digital experience monitoring, application monitoring, user monitoring, and performance lifecycle management among other features.
It utilizes proprietary AI big data analyses. The tool turns out to be very useful to server network administrators interested in administering thousands of servers from a single central hub.
That said, this SolarWinds NPM Competitor helps network administrators identify network bottlenecks, troubleshoot issues, and plan effectively for network and server resources.
Operating Systems: Desktop and Web-based
Features:
- Automated performance monitoring of over 10,000 hosts.
- AI detection of anomalies and dependencies between applications.
- Root cause analyses for every issue.
- Capability to automate performance management.
- Supports API integration into user platforms.
- Auto-discovery of network assets and resources.
- Capability to self-heal.
- Monitors and provides insights about customer experience.
- Integrates to/with Amazon EC2, HipChat, ManageEngine AlarmsOne, OpsGenie, PagerDuty, ServiceNow, Slack, and VictorOps.
Pros:
- Integration with AI through the Davis AI engine enhances operational efficiency by promoting better performance analysis and issue detection.
- In-depth insights into user actions through the Session Replay feature and other similar features. This enhances precise troubleshooting and performance enhancements.
Cons:
- Documentation lags behind features being deployed.
- Setting up alerts can turn out to be complex, especially for companies with massive environments.
Pricing: Dynatrace offers a free trial. The price is based on what kind of monitoring the user needs:
- Full Stack Monitoring is $0.8 per hour for an 8GB host
- Infrastructure monitoring is $0.04 per hour for any size host
- Kubernetes monitoring is $0.002 per hour for any size pod
- Application security is $0.018 per hour for an 8GB host
- Real-user monitoring costs $0.00225 per session
- Synthetic monitoring is $0.001 per synthetic request
- Log management analyses costs $0.20 per GiB (Ingest & Process), $0.0007 per GiB per day (Retain), and $0.0035 per GiB (Query).
Website: https://dynatrace.com
#11) Auvik
Best for machine-learning-based traffic monitoring.

The Auvik cloud-based network monitoring and management software tracks the availability and performance of servers, networks, network devices, network protocols, applications, VMs, system metrics, and cloud services in real-time.
Like most network monitoring tools in its category, Auvik automates network device discovery for visibility and control. It supports REST API for integration with other resources.
A collector agent needs to be installed for each host to collect data and inform of its status, performance, availability, faults, and other aspects of network monitoring.
Operating Systems: Windows Server 7 and above, MacOS 12 and above.
Features:
- Network traffic analyses using Auvik TrafficInsights, which utilizes machine learning and traffic classification to show which and how services (such as Dropbox, Netflix, and Slack) are utilizing bandwidth.
- Network and device visibility on networked servers and workstations. The automated inventory feature detects and captures full details of all connected devices. This includes serial numbers, IPs, and physical switch ports.
- Hardware life-cycle data pulled by the tool helps the user determine whether there are current or expired contracts, up-to-date software versions, if devices are liable to receive security updates, if devices are still available for purchases, etc.
- VPN monitoring, syslog monitoring, etc.
- Security protocols include data isolation, encryption, access control, single sign-on, 2FA, and role-based access controls.
- Reporting. Provides Power BI reporting templates, e.g. QBR, inventory management, NOC service, and device performance management reports.
- Remote management of the tool is supported.
- SNMP, WMI, SSH, telnet, and VMware.
Pros:
- Pricing includes unlimited users, number of network sites, number of endpoints, and full support for all plans.
- Machine-learning based traffic analyses and classification can help to better improve network performance and management.
- Multiple optional security protocols are supported for securing the backend.
- More affordable compared to SolarWinds.
Cons:
- Clients require installing agents individually to monitor remote networks. This can be a challenge, especially for companies with extensive networks with multiple remote locations to monitor.
Pricing: There is a 14-day trial period. The Essentials cost $15/month per network device while the performance costs $25/month per network device.
Website: https://auvik.com
Frequently Asked Questions
1. Is SolarWinds a leader in network observability?
SolarWinds is a popular option for those buying network and cloud observability tools and software for instance, as recognized in GigaOm Radar Reports. It enables on-premises, cloud, and hybrid environment monitoring of networks and network devices.
It is extensible through coding with public API and using third-party integrations. SolarWinds offers a 30-day trial period.
2. What is network monitoring software?
Network monitoring software can be deployed on servers and operating systems to monitor network resources, services, traffic, users, and devices in real-time, detecting any anomalies that may impact user experience, network uptime, device availability, and overall performance. This is done to prevent and troubleshoot such issues.
3. What is SolarWinds network performance monitor (NPM)?
SolarWinds NPM provides advanced monitoring capabilities for monitoring network devices, traffic, users, network resources and services, and related configurations on the cloud, on-premises, and hybrid environments.
It is thus used for end-to-end visibility of device and network resources, bandwidth analysis, performance testing, network configuration monitoring, and issue resolution.
4. What does SolarWinds do?
SolarWinds provides on-premises and SaaS network performance monitoring software with which companies can keep tabs on how optimal their company network resources, services, and related devices are functioning.
5. How does SolarWinds NPM network Atlas work?
SolarWinds’s in-built network Atlas is used to graphically view the network and related resources and services. It also allows the user to view the related performance statistics in real time via dynamic network maps.
Users can even automatically display connections between network devices and create custom maps using available templates in the platform. They can import a logistical image of their network based on floor, building, department, or geographical location, or create network maps on their desktop and export it into the tool.
Criteria to Consider When Choosing Alternatives to SolarWinds
- Cost-effectiveness with access to similar functionality and features.
- Solutions that offer access to all features and functionality in one module instead of multiple separated modules at an additional cost.
- Ease of use
- Available platforms.
- Scalability and performance. Consider solutions that can fit your size of organization at a lesser cost and with the ability to provide more room for additional growth.
- Security features and compliance.
- Integration capabilities
Conclusion
While SolarWinds NPM offers software capable of detailed and comprehensive analysis of network resources and services in on-premises, cloud, and hybrid environments, it is one of the more expensive monitoring software when compared to the options I reviewed.
Besides, there may be a challenge in using it across other operating systems. There are some advantages with other brands, such as AI monitoring integration and extended integration support with APIs, plugins, and extensions. Paessler PRTG, Obkio, Netreo, Zabbix, and Datadog are some of the best alternative network performance monitoring tools for SolarWinds NPM.
Review Process:
- Tools initially listed for review: 30
- SolarWinds NPM Competitors reviewed: 10
- Time taken to review: 3 days


