


An In-Depth Look at the Most Popular Reporting Tools:
What is Reporting Software?
Reporting Software connects with data sources, gathers information, and provides insights as graphs and charts based on the input data so the user can find useful information.
This application usually comes in a business intelligence suite. The reporting tools help in the decision-making process. Detailed insights will give you more visibility over data. Reporting tools attractively present the data. By representing the data in an attractive manner, these tools make data more readable, useful, and presentable.
Table of Contents:
- Reporting Software: Market Trends
- Review of Top Reporting Tools
- Comparing the Best Reporting Tools
- #1) Zoho Analytics
- #2) Joiin
- #3) HubSpot Marketing Analytics
- #4) Signm
- #5) Answer Rocket
- #6) SAP Crystal Reports
- #7) Izenda Reports
- #8) DBxtra
- #9) Datadog
- #10) BIRT
- #11) KNIME
- #12) GoodData
- #13) Phocas
- #14) Microsoft Power BI
- #15) Whatagraph
- #16) Oribi
- #17) Juicebox
- #18) FineReport
- #19) Query.me
- #20) Integrate.io
- #21) Better Stack
- #22) Two Minute Reports
- Conclusion
Reporting Software: Market Trends

There can be two types of reports, i.e. Static reports and Interactive reports.
The end-user can not alter static reports, and interactive reports allow you to get detailed insights by drilling down to the data. These reports also provide the facility to navigate, filter, sort, & view the data.
These reporting tools can generate different types of reports as shown below:
- Reporting for business intelligence,
- Visualization and reporting,
- Self-Service reporting,
- Enterprise reporting,
- Application performance reporting,
- Finance-related reporting.
Generally, it is considered that reporting tools and business intelligence software are the same, but there is a difference between the two.
Reporting tool or software is a part of a business intelligence suite, whereas Business intelligence software contains various categories of tools. The main difference is in their ability to correlate the data.
Review of Top Reporting Tools
Enlisted below are the most popular and commonly used Reporting tools that are available in the market.
Comparing the Best Reporting Tools
| reporting Tool | About Tool | Best Features | Verdict | Price |
|---|---|---|---|---|
| Zoho Analytics | This self-service BI and reporting tool helps business users create cross-functional reports easily. | Intelligent assistant, unified business analytics, white label / embedded BI, 100+ connectors with pre-built reports and dashboards. | The tool provides smart data alerts and forecasting. It makes use of AI, ML and NLP technologies. | Free Plan, Basic ($22/month), Standard ($45), Premium ($112), and Enterprise ($445). |
| Joiin | Automate how financial data is consolidated. | Consolidated finance reporting, budgeting, multi-client management, business KPI reports. | Joiin is one of the best reporting solutions you can opt to gain complete visibility over your company’s finances. | Starts at $19/month. |
| HubSpot | Measure the performance of your entire marketing funnel at once place | Built-in analytics, reports, and dashboards. | All-in-One Inbound Marketing Software. Supports Blogging, Landing Pages, Email, Marketing Automation, Lead Management, Analytics, CMS | FREE for most of the features. |
| Signm | AI-driven financial and social media analysis | Social media post analysis, financial new article analysis, sentiment analysis | The software uses AI to analysis information across the web that could give you an edge in investing. | Starts at $9/month (billed annually) |
| Answer Rocket | Web-based tool for business people. Provides Self-service analytics | Easy customization options. Sending reports through emails. | Ask questions in natural language. | Contact company. |
| SAP Crystal Reports | It is a business intelligence and reporting tool for small and medium-sized businesses. | Content distribution in PDF, Spreadsheet, and HTML. Supports multiple languages for reports. | The tool takes care of data security and it changes formatting as per the language. | $495 per license. |
| Izenda Reports | Business intelligence and reporting tool used by software companies and development teams. | Integrated security. Ad-hoc reporting. Finance related forecast. | This system can be used by any sized enterprises and supports multiple languages. | Contact company. |
| DBxtra | It is a web-based business intelligence and reporting tool for ad-hoc reporting. | XL Reporting Service. Automatic report generation on scheduled time. | The system is easy to use and learn. Programming knowledge is not required. | Price starts at $980. |
| Two Minute Reports | Automate how key performance reports are generated. | Automating reports, creating live dashboards, AI-driven insights, templates | A great software that streamlines reporting across multiple data sources. | Starts at $8/month (billed annually) |
Let’s Explore!!
#1) Zoho Analytics
Price: Free Plan, Basic ($22/month), Standard ($45), Premium ($112), and Enterprise ($445).

Zoho Analytics is an easy-to-use reporting software. It allows users to create actionable reports in minutes from any data. It features an AI-powered assistant that can get its users intelligent answers for their questions, in the form of meaningful reports.
Features:
- 100+ connectors for popular business apps, cloud drives, and databases.
- Wide variety of visualization options such as Charts, Pivot tables, summary views, KPI widgets, and custom-themed dashboards.
- Unified business analytics that analyzes data from across business apps.
- Augmented analytics using an AI and ML-powered intelligent assistant that can understand queries asked in natural language.
- White label solutions for embedded analytics and BI/analytics portals.
Best Features: Intelligent assistant, unified business analytics, white-label / embedded BI, 100+ connectors with pre-built reports and dashboards.
Verdict: The tool provides smart data alerts and forecasting. It makes use of AI, ML, and NLP technologies.
#2) Joiin
Price: Joiin comes with a 14-day free trial. Its subscription plans are as follows:
- Starter: $19/month
- Small: $35/month
- Medium: $58/month
- Large: $91/month
- X-Large: $175/month
- XX-Large: $280/month
Joiin is a software ideal for creating finance reports quickly and comprehensively. The tool is perhaps best known for automating how you consolidate data pertaining to your company’s finances. The tool consolidates your profit & loss statements, balance sheet, cash flow, and other reports and presents it to you in one place.
Features:
- Customize consolidated reports
- Create presentations containing multiple sets of reports
- Reports come loaded with key KPI metrics
- Report across multiple currencies and automate conversions
- Manage complex intercompany finances
Best feature: Consolidated finance reporting, budgeting, multi-client management, business KPI reports
Verdict: Joiin is one of the best reporting solutions you can opt to gain complete visibility over your company’s finances. By consolidating your financial data and creating comprehensive reports, this is a tool you can use to make informed decisions about your company’s finances.
#3) HubSpot Marketing Analytics
Price: Free for most of the features
You can measure the performance of your complete marketing funnel in one place with robust built-in analytics, reports, and dashboards. HubSpot Marketing Analytics has everything you need to be a smarter marketer.

You can make quick and smarter decisions backed with integrated analytics.
Features:
- Measure marketing funnel from acquisition to close
- Track customer from anonymous visitor to loyal customer
- Discover key trends in your data over time
- Help marketing efforts by closing down the loops and focusing on revenue opportunities
- Analyze site performance with key website metrics
- Detailed reports for each marketing channel
- All-in-One Inbound Marketing Software
Supports: Blogging, Landing Pages, Email, Marketing Automation, Lead Management, Analytics, CMS, Social Media, SEO, Ads, and much more.
#4) Signm
Best for: AI-driven financial and social media analysis
Fees: Subscriptions to the platform starts at $9/month. You will be billed yearly.
Signm is not your typical reporting platform. This app arms you with invaluable insight to make smart investment decisions. Signm’s AI lets you assess millions of opinions every day about the stock market.
The platform analyses over 1500 news articles and 2 million social media posts to provide you wish information that could prove useful in your investment endeavors.
Features:
- Analyses thousands of financial news articles
- Analyses millions of social media posts
- Sentiment analysis, which entails
- Get insight on what’s trending in the world of finance
- Get Advanced comprehensive charts to help you make informed decisions.
Best features: Priority support, Smart notifications, Complete AI-powered, sentiment analysis.
Verdict: If you wish to make informed decisions when investing or trading in the stock market, then this AI-powered analysis tool was tailor-made for you.
#5) Answer Rocket
Pricing: Contact the company for pricing details.

Answer Rocket is suitable for any business. As this tool is made for business people, no technical skills are required. Anyone from the team can generate reports and analytics. It is a web-based tool, hence it can work with any operating system.
Features:
- You can ask a question and based on your question, the chart will be created.
- It allows you to ask questions in natural language.
- Easy customization options are available like colors, labels, etc.
- Reports will automatically get saved to the dashboard.
- Full data exploration.
- You can send reports through emails. It also allows you to set up a schedule for sending reports.
Verdict: This web-based tool can work on any operating system. It allows you to set up a schedule for sending the report. It supports asking questions in natural language.
Website: https://www.answerrocket.com/
#6) SAP Crystal Reports
Pricing: $495 per license.

It is a business intelligence and reporting tool. It provides a design interface and efficient workflows. The tool will ensure data security and small and medium-sized companies can use it.
Features:
- Content can be distributed in formats like PDF, Spreadsheet, and HTML.
- The tool supports multiple languages for reports.
- It allows you to change the formatting of reports as per the language if required.
- The tool can directly connect to data sources without data modeling.
Verdict: Supports many formats like PDF, Spreadsheet, and HTML Data security will be taken care of. Multiple languages and formatting according to a particular language.
Website: https://www.sap.com/products/crystal-reports.html
#7) Izenda Reports
Pricing: Contact the company for pricing details.

Izenda Reports is a business intelligence and reporting tool.
Its users can decide when and how to access the data using this self-service reporting. It can be used by software companies and development teams to place the BI and reporting functionality into their application. It is accessible on a desktop using web browser and mobiles. It can also be deployed on-premise.
Features:
- Real-time sharing and customization of reports and dashboards.
- It provides integrated security.
- It introduces analytics seamlessly in the end-user workflow.
- As it is a web-based tool, data is accessible from any device.
- Build charts and grids.
- It also allows you to add filters.
Further Reading => List of the TOP Reservation System Software
Verdict: This system can be used by any sized enterprise. It supports multiple languages. It can be used for Ad-hoc reporting, Finance-related forecasts, profit analysis, and several other purposes.
Website: https://www.izenda.com/
#8) DBxtra
Pricing: Price starts at $980.

DBxtra is a business intelligence and reporting tool for ad-hoc reporting. It is a web-based reporting interface, which also provides free desktop report viewer. Its Dashboard designer helps in creating web-based dashboards. It is a cloud-based solution for companies to create and distribute web reports.
Features:
- It can automatically generate reports on the scheduled time.
- With the help of report designer, it will be easier and quicker to create database connections, reports, and queries.
- XL Reporting Service allows you to view real-time data in Microsoft Excel.
Verdict: Easy to use. SQL programming & web-technologies knowledge is not required. It is a powerful, flexible, and easy-to-learn reporting software.
Website: http://www.dbxtra.com/
#9) Datadog
Pricing: For the infrastructure, there is a free plan.
Apart from that Pro plan ($15 per host per month), and the Enterprise plan ($23 per host per month) are available. The price for log management starts at $1.27 per month. Whereas the Price for application performance management starts at $31 per month.

Datadog is a monitoring and analytics software. It provides application performance management, log management, dashboards, and alerts functionalities. It includes full API access.
Features:
- Datadog provides more than 250 built-in integrations for several other functionalities like messaging, notifications, orchestration, issue tracking, etc.
- It also provides integration with AWS and Azure.
- Visibility to the performance of your application.
- Collect logs from all your services, applications, and platforms.
- Can create graphs in real time.
- Give notifications or alerts on critical performance issues.
#10) BIRT
Pricing: Open source.

BIRT is an open source tool for data visualization and reports. This tool is used by development teams to include the reporting functionality in web applications. Mostly it is used in Java and Java EE projects. It can be used by all types of organizations.
Features:
- OS agnostic.
- Supports businesses from various industries.
- It can be integrated with any data source in any environment.
Verdict: Good community support at Eclipse.org. Easy to integrate.
#11) KNIME
Pricing: Free

KNIME is an open-source analytics platform. It is used for creating data science applications and services. It supports Windows, Mac, and Linux operating systems. KNIME is used for financial data analysis, business intelligence, and pharmaceutical research.
Features:
- Useful for creating visual workflows.
- It allows you to use different domain tools.
- It can work with simple text formats, unstructured data types, and time series data.
- It can connect with many databases like Oracle, Microsoft SQL, Apache Hive etc.
Verdict: It provides the best features of data & tool blending.
#12) GoodData
Pricing: Contact the company for pricing details. 30 days free trial is also available.

It is a cloud-based solution. The tool can give you visibility for sales, marketing, social and customer service efforts. Using this tool you can deliver fully-managed insights.
Features:
- It gives you insights from combined points of data.
- It allows you to use private or public cloud using Amazon, AWS, and Rackspace.
- This system can be directly combined with your existing system.
- It provides analytics customization to reflect your brand.
Verdict: Good data is easy to use and has interactive dashboards.
#13) Phocas
Pricing: As per the reviews available online its price starts at $500 per month per user. Contact the company to know more about its pricing details.

Phocas is a business intelligence and data analytics platform.
It provides you with a flexible solution that can scale as your organization grows. This software is for the distribution, retail, and manufacturing industries. It can be accessed from mobiles and tablets. It provides many out-of-the-box integrations with popular ERPs.
Features:
- It is optimized for any type of device like desktop, notebook, tablet, and smartphone.
- It allows you to schedule reports and set alarms based on the reports.
- Real-time reporting and analytics.
- It provides cloud-based as well as an on-premise solution.
- It also provides a private cloud option.
Verdict: There is a database designer in the latest versions of Phocas. It provides many features like collaboration, financial statements etc.
#14) Microsoft Power BI
Pricing:
- Free Plan.
- Power BI Pro: $9.99/user/month.
- Power BI Premium: $4,995/dedicated cloud storage and compute resources/month, $20/user/month.

Power BI is a collection of analytics and reporting tools that help ingest, process, model, and report data in the form of compelling and easy-to-digest reports.
Features:
- +120 free native data source connectors.
- A vast library of pre-built visuals.
- Creating custom visuals.
- Interactive dashboarding with the drill-down functionality.
- Scheduled and ad-hoc reporting.
- Mobile and embedded reporting
- Publishing and consuming paginated reports.
- Embedding reports and dashboards in a custom application or other SaaS applications.
- Protecting exported data with data protection sensitivity labels.
- Workspace and row-level security.
- Availability in Microsoft national clouds.
- Natural language user interface for quick querying of data with natural language.
- AI-based data preparation and modeling.
- Multi-language support (DAX, Power Query, SQL, R, and Python.)
Verdict: A unified platform for self-service and enterprise-wide analytics and reporting. Ad-hoc and scheduled reports for different user groups (C-suite, management, employees, etc.). Pre-built and customizable visuals for spotting and sharing business insights in real time.
#15) Whatagraph
Pricing: Offers a 7-day free trial. Professional ($119/month), Premium ($279), Growth ($699).

Whatagraph is a cross-channel marketing performance reporting tool. It allows marketers to track, measure, and analyze all of the marketing efforts in an easy-to-understand way.
Marketers can automatically gather data from different marketing channels, create visual reports and automate them in just a few clicks. Whatagraph offers over 30 data channels integration and Custom API for company-level analytics.
Features:
- 30+ integrations
- Drag & Drop dashboards and reports builder
- Cross-channel reporting
- Custom data import
- Public API
- Live chat support
Best Features:
- Custom/Whitelabel report branding.
- Report sending automation (daily, weekly, bi-weekly, monthly).
- Prebuild widgets & templates for easy report building.
- Live data monitoring
Verdict: Easy to use, from data collection to report building and automation. View all of your marketing efforts in one place and make data-driven decisions.
#16) Oribi
Pricing: Oribi can be tried for free. For a Business Website, the pricing plans start at $630 per month. For eCommerce shops, plans start at $540 per month. The pricing plan for a marketing agency starts at $900 per month. All these prices are for annual billing.

Oribi is a marketing analytics tool with powerful features. It makes analytics easier. It has the capabilities of insights & trends, event tracking, reports, visitor journey, etc. It is the right platform for customized reports. It allows sharing of work with others.
Features:
- Oribi will provide ready-made and beautiful reports.
- It will let you customize the reports for the look, logos, and data.
- Oribi has features for the automatic sharing of reports on a schedule.
- Oribi provides actionable insights and helps with understanding the trends.
Best Features: Ready-made reports, customizable reports, scheduling reports, etc.
Verdict: Oribi is a marketing analytics tool that can provide the reports in a button click. It provides beautiful reports and will let you schedule and share them.
#17) Juicebox
Pricing: Free Plan for up to 3 users with unlimited usage. Team Plan is $49/month for 5 editors, 15 viewers.

Juicebox is the easiest, most beautiful way to create visually engaging, interactive data visualizations and presentations. With a focus on data storytelling and usability, Juicebox stands out from other visualization tools. The pricing model is free for individuals and affordable for teams.
Key Features
- A unique data storytelling approach.
- Easy-to-learn editing
- Interactive data visualizations with easy configuration.
- Simple styling options ensure a professional design.
- Visualizations automatically connect for drill-down data exploration.
- Connect to multiple data sources via data upload or database connection.
- Responsive layout for mobile viewing.
- User management with public or private publishing.
Best Features
- Easy to get started. Non-technical users can learn how to build interactive data presentations, reports, and dashboards in minutes. Juicebox makes it quick to come up to speed, unlike more complex analytics tools.
- Professional design. Juicebox makes user experience design a priority so that the interactive applications reflect well on you. Pre-defined styles (fonts and colors) and layouts result in data visualization websites that look like they were custom-built.
- Data storytelling. Inspired by modern data journalism and visualization techniques, Juicebox apps focus on guiding end-users through data more like a presentation than a traditional self-service BI platform.
Verdict: Juicebox makes it possible to quickly create top-quality reports, dashboards, and infographics. Unlike more technical visualization solutions, Juicebox is able to combine lightweight, in-browser editing with impressive, modern visual design.
#18) FineReport
Price: Free for personal use, quote-based for enterprises.

FineReport is 100% java reporting software for enterprises to deal with reports and dashboards’ complex needs and gain insights into their business operations. It offers three intuitive and innovative report design patterns for IT and business departments to meet various report application scenarios.
Features:
- Support broad data sources connection and data integration from multiple sources.
- One-click to export reports in Excel, PNG, and PDF and push automated reports via email.
- Support input data into databases via web forms for data collection.
- Provide plenty of 2D&3D HTML5 charts and GIS maps(API supported) with cool animations.
- You can view and interact with reports on PC, Mobile, and large screens.
- Support embedding CCTV, BIM in dashboards for IoT scenarios.
- Flexible enough to integrate, customize and extend.
- Provide an all-in-one management platform for user management and authorization.
Best Feature: Data entry function for data collection, scheduled report, mobile reporting, TV and large screen display, all-in-one management platform, 3D charts with cool animations, multiple formats exportation
Verdict: FineReport makes every reporting process easy and intelligent, from data collection and integration to reports presentation and management.
#19) Query.me
Query.me is an analysis and reporting tool that aims to revolutionize the way people look at data by introducing powerful SQL Notebooks that deliver true insights instead of plain old dashboards.

With Query.me you get the entire team on the same page by using flexible tools to collect, analyze and visualize data. Users can schedule automated distribution of reports that allow for a great deal of customization.
Features:
- Full self-service support
- Customizable SQL notebooks
- Scheduled reporting
Verdict: Query.me is a simple tool that allows you to create complex reports based on SQL without the need to have a support team around to help you at every step and with the fully customizable reporting you’ll be able to turn data into stories that help your company make better decisions.
#20) Integrate.io
Price: It offers a free trial for 7 days. You can get a quote for pricing details. Integrate.io follows a subscription-based pricing model.
Integrate.io is a cloud-based data integration platform. It offers solutions for marketing, sales, support, and developers. Integrate.io will help you to build complete marketing and a sales analytics solution. You can build effective & comprehensive campaigns & strategies.
Integrate.io’s marketing solution will provide up-to-date, transparent, and accurate marketing information. It will provide data-driven insights. You will get a big picture and actionable insights from your campaigns. Integrate.io will help you to increase conversions and improve marketing strategies.
A Customer support solution will provide comprehensive customer insights so that you will be able to target the right customers and cross-sell complementary products or services.
Features:
- With the help of Integrate.io’s marketing solution, you will be able to integrate all your marketing sources such as social media data, analytics, and CRM data.
- You can integrate your customer support data with data from other relevant sources like social media, analytics, etc. This sales solution will help you with better business decisions.
- Integrate.io’s customer support analytics solution will provide comprehensive insights.
- It will allow you to integrate your customer support data and the data from other relevant sources like social media and CRM.
- Integrate.io provides a solution for developers that will help them increase bandwidth and maximize efficiency.
- Integrate.io offers both low-code or no-code options.
Supports: Data integration, ETL, and ELT.
#21) Better Stack
Price: Log Management Plan starts at $30/month, Uptime plan starts at $24/month.

Better Stack delivers robust reporting on detected incidents and other system performance issues. You are immediately presented with a screenshot of the error detected. Furthermore, you get a second-by-second report on how a particular incident developed and evolved over time. The reporting is backed by a highly configurable visual dashboard.
Features:
- Pre-Built Visual Dashboard
- Escalate incidents based on time, origin, and availability
- On-call scheduling
- Second-by-second audit timelines
Best Features: Incident management and uptime monitoring, second-by-second audit timeline.
Verdict: With Better Stack, you essentially get a comprehensive cloud monitoring solution that excels with its advanced reporting on incident and system uptime.
Check our Better Stack Detailed Review
#22) Two Minute Reports
Price: Two Minute Reports offers the following subscription plans:
- Lite: $8/month
- Basic: $41/month
- Pro: $83/month
- Business: $291/month
All plans are billed annually. A 14-day free trial is also available.
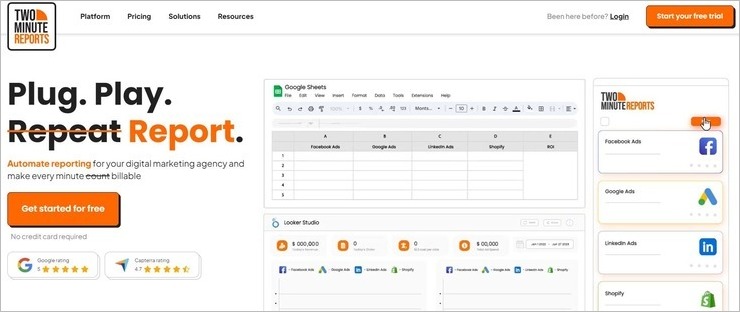
Two Minute Reports serves as an intuitive reporting add-on for Google Sheets. This tool can integrate and pull data from over 30 prominent sources. This includes Shopify, Facebook Ads, Microsoft Ads, TikTok Ads, and more. These data are then processed and presented as comprehensive and visually informative reports.
Features
- Automated Report Generation
- Create White Labelled Reports using a variety of ready-made templates
- Integrates with over 30 data sources.
- Create and share live dashboards.
- Get insights on performance questions with AI.
Best for: Automating reports, creating live dashboards, AI-driven insights, and templates.
Verdict: If you are looking for software that streamlines and automates reporting across multiple data sources, then Two Minute Reports was tailor-made for you.
Website: https://twominutereports.com/
Conclusion
We have come to the end of the article on Reporting Tools. To conclude, let’s see a one-liner about each tool for your quick understanding.
Answer Rocket will give you full data exploration. SAP Crystal Reports can distribute the content in PDF, Spreadsheet, and HTML format. Izenda can be used for profit analysis and finance-related reports.
DBxtra is powerful, flexible and easy to use. GoodData gives you visibility for sales, marketing, social and customer service efforts. Phocas is a flexible and scalable solution which provides a private cloud option.
BIRT and KNIME are the best free reporting tools. Zoho Analytics, Datadog, and Phocas provide monthly subscription plans. But Datadog has more affordable monthly plans.
Hope this informative article on Reporting Tools has enriched your knowledge to a great extent.!!
Was this helpful?
Recommended Reading
-

List And Comparison Of The Best Data Governance Tools. What is Data Governance? Data Governance is a centralized control mechanism to manage data availability, security, usability, and integrity. To implement data governance in the organization, a committee, a defined set of procedures, and a plan for executing these procedures are…
-
Explore the Best open source free and online Data Modeling Tools along with their Features: What is Data Modeling? Data modeling is the process of applying the techniques and methodologies to the data (data requirements) in order to convert it in a useful form. The process converts complex software design…
-

A Comprehensive List Of The Best And Popular Test Data Management Tools. The process of planning, designing, storing, and managing the software or the source code of an application for testing is called Software test data management. The main objective of the test data management is to check and test…
-
Explore the Best Data Science Tools Available in the Market: Data Science includes obtaining the value from data. It is all about understanding the data and processing it to extract the value out of it. Data Scientists are the data professionals who can organize and analyze the huge amount of…


