List Of The Best hand-picked Managed Security Service Providers of 2026:
Anyone who is using the internet is exposed to attack. The attack can be of any type, maybe a malware or a type of hacking, spam emails or DDoS attack, etc.
When these types of attacks happen to your website, it will have a great impact on your business. In order to avoid this, the network security services that an organization outsources to a service provider are known as Managed security services (MSS).
Thus these services are required in order to manage the IT security of any organization.
Table of Contents:
- Managed Security Services And Vendors
- Top Managed Security Service Providers MSSPs
- Comparison of Top MSSP Vendors
- #1) Indusface WAS MSSP
- #2) Security Joes
- #3) SecureWorks
- #4) IBM
- #5) Verizon
- #6) Symantec
- #7) Trustwave
- #8) AT&T
- #9) BT
- #10) Wipro
- #11) BAE Systems
- #12) CenturyLink
- #13) Anomalix
- #14) Intrust IT
- #15) Foresite
- #16) Trustnet
- #17) TSC Advantage
- #18) Global IP Networks
- #19) Cipher
- #20) Andersen Inc.
- #21) ScienceSoft
- #22) UnderDefense
- #23) SecurityHQ
- #24) Dataprise
- Additional MSSP Providers
- Conclusion
Managed Security Services And Vendors

A vendor who provides managed network and other security services is called a Managed Security Service Provider (MSSP).
The concept of MSSP has been originated from the ISP (Internet Service Provider).
Previously this type of security was provided through firewall protection by Internet Service Provider (ISP). And customers were charged through the dial-up connection charges. This firewall protection was installed separately on the customer’s machine and they were called as Customer Premises Equipment (CPE).
Hiring the people in a company to manage these security functions can be an expensive option. So outsourcing the security services will be a cost-effective option. Previously these providers served only large scale industries or businesses.
But now many MSSPs offer their services to small as well as medium-sized businesses.
Services included in Managed Security:
- 24*7 monitoring for threats,
- firewall management,
- patch management,
- Security audits,
- incident response

[image source: csiweb.com]
Categories of Managed Services in IT Security:
- In-site Consulting: It includes integration with other products, support after attack and emergency incident response.
- Perimeter management of the client’s network: It includes firewall management, and detecting threats for hardware & software.
- Managed security monitoring: It includes continuous monitoring of the network for threats.
- Penetration testing and vulnerability assessments: It includes scanning of applications and attempting to hack the application so that any vulnerabilities present will be found.
- Compliance monitoring: It includes keeping the logs for changes in the system in terms of violating the security policies.
Our TOP Recommendations:
 |
| Indusface WAS MSSP |
| • Malware Scanning • DAST • Penetration Testing |
| Price: Starts at $59/month Free Trial: Available |
| Visit Site >> |
Top Managed Security Service Providers MSSPs
Given below is the list of top vendors providing these services.
- Indusface WAS MSSP
- Security Joes
- SecureWorks
- IBM
- Verizon
- Symantec
- Trustwave
- AT&T
- BT
- Wipro
- BAE Systems
- CenturyLink
- Anomalix
- Intrust IT
- Foresite
- Trustnet
- TSC Advantage
- Global IP Networks
- Cipher
- Andersen Inc.
- ScienceSoft
- UnderDefense
- SecurityHQ
- Dataprise
Comparison of Top MSSP Vendors
| Tool Name | Industry Size | Industries | Services Provided | Credits |
|---|---|---|---|---|
| Indusface WAS MSSP | All Businesses | Retail, Insurance, Banking, Financial Services, MSSPs, Healthcare | Malware Scanning, DAST, Vulnerability Assessment, Penetration Testing | Gartner Peer Insights Customers’ Choice 2023. |
| Security Joes | Small, Medium and Large that acquired or interested in acquiring an EDR solution | Gov Agencies, Financial Institutes, Insurance, Telecom, iGaming, e-Commerce, Transportation, Manufacturing, Industrial, FinTech, Real Estate, Healthcare, Energy and more | 24/7 Incident Response, Crisis Management & Follow-The-Sun MDR (Managed Detection & Response), Compromise Assessment, External Attack Surface, Red Team, Phishing Simulations, Malware Analysis, Threat Hunting, Threat Intelligence, Vulnerability Management, | Specialized in incident response and crisis management services |
| Secureworks | Large Enterprises | Financial Manufacturing & Retail | Security Monitoring Endpoint security Customize solutions | 4400 Clients 250 B Security events |
| IBM | Medium size corporations. | Healthcare Retail and consumer products Banking & Finance Chemicals Construction Electronics Aerospace and Defense and many more. | Firewall management Endpoint security services Amazon GuardDuty services Threat management. Security intelligence Cloud based log management. Intrusion management etc. | Can tackle complex business problems |
| Verizon | Enterprise and Medium size businesses. | Construction, Financial Services, Healthcare, Insurance Retail, Manufacturing & Automotive Public Sector and many more. | Endpoint protection Firewall Load balancers Proxy server, VPN Application level Firewall etc. | Gartner Magic Quadrant-2018—Leader in this list. |
| Trustwave | Small, Medium and Large enterprises. | Education, Financial services, Government, Healthcare Hotels Legal, Payment Services, Restaurants, And retail. | Threat Management Vulnerability management Compliance management | 2 Billion security and compliance events logged each day. one million Endpoints scanned each day. 250 technical support engineers |
| Anomalix | Small, Medium and Large enterprises. | Financial Services Healthcare Manufacturing Technology Energy Education Government | Threat Management Vulnerability Management Malware and Ransomware detection, Endpoint protection Protection for network, data, application, and cloud. | Sales increased by 20% Cost of compliance reduces by 50% Cost of managing reduced by 70% |
| Intrust IT | Small and Medium size business. | — | Endpoint protection Can detect and protect from Ransomware | One of the top 10 managed security service provider of 2017 –Enterprise Magazine |
| Foresite | — | Legal Insurance Financial Retail PCI Healthcare Education | Threat management Incident Response Security Monitoring | 962 projects completed successfully |
| Trustnet | Mid-size and Large. | Public and private Sectors of multiple industries. | Penetration Testing, Cybersecurity Risk, Incident Response & Cloud Security | Provides threat intelligence: 80,000 Contributors 140 Countries Daily threat indicators: 19,000,000 |
| TSC Advantage | Small | Insurance Financial Government Security services Healthcare Manufacturing Utilities | Vulnerability management Can optimize the third party cyber risk management program. | One of the top 10 managed security service provider of 2017 –Enterprise Magazine |
| Global IP Networks | Small, Medium and Large enterprises. | Financial, healthcare, oil & gas, education, telecommunication & enterprise | Advance Threat intelligence Compliance services Continuous Monitoring | Meets SSAE 16 SOC-2 Type ||, PCI & HIPAA standards. |
| SecurityHQ | Small, Medium and Large Enterprises. | Financial services, Banking, Real-Estate, Insurance, Public Sector, Local Government, Tele communications, Property & Construction, Transport, Energy, Oil & Mining. | 24×7 Managed Security Services, Managed Detection and Response (MDR), XDR, Managed Firewall, Managed Endpoint Detection & Response (EDR), Threat & Risk Monitoring, Vulnerability Management Services, etc. | For unrivalled regional expertise with international oversight, SecurityHQ runs and operates out of 6 Security Operation Centres globally, using only Enterprise Grade Gartner Top Right Magic Quadrant Technology. |
| Dataprise | All Businesses | Any | 24×7 Help & Support Desk Cyber Security, IT Consulting & Strategy, Monitoring & Management, Cloud Services |
Let’s Explore!!
#1) Indusface WAS MSSP
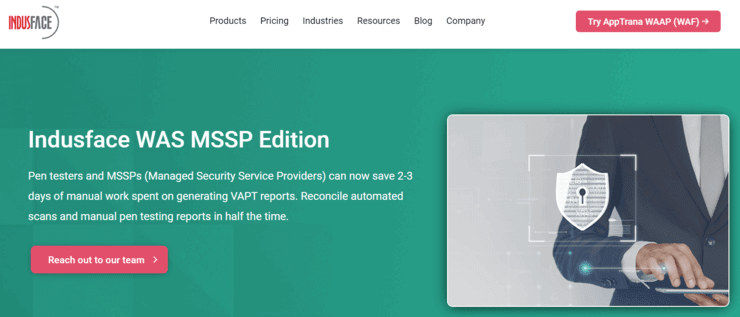
Indusface offers a DAST scanner that is ideal for most pen-testers and managed security service providers. The tool can easily identify OWASP Top 10 WASC 25, and other such threats with ease.
Best for all businesses.
Services Provided: Dynamic Application Security Testing, Malware Scanning, Vulnerability Assessment, Virtual Patching
Established in the Year: 2012
Industries: Banking, Financial Services, Healthcare, MSSPs, Retail, Insurance, Pen-Testers.
Company Size: 51-100
Company Revenue: $8.7 Million
#2) Security Joes
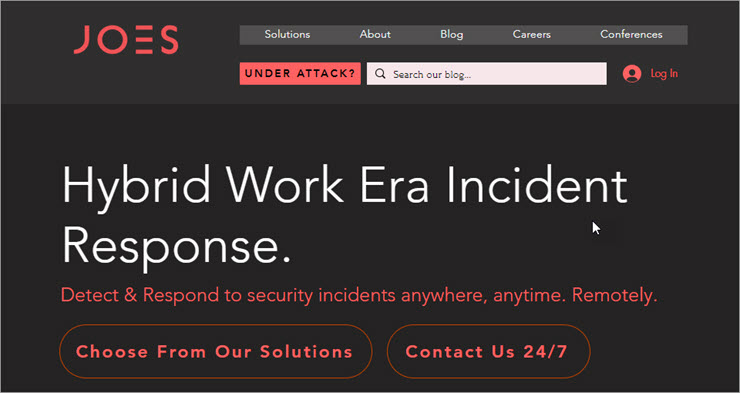
Security Joes is a multi-layered incident response & crisis management company with global outreach in 7 different time zones and a follow-the-sun approach.
Best for: Small, Medium and Large that acquired or are interested in acquiring an EDR solution.
Established in the year: 2020
Core Services Provided:
- 24/7 Incident Response, Crisis Management & Follow-The-Sun MDR (Managed Detection & Response)
- Compromise Assessment
- External Attack Surface
- Red Team
- Phishing Simulations
- Malware Analysis
- Threat Hunting
- Threat Intelligence
- Vulnerability Management
#3) SecureWorks

Company size (employees): 300+ Employees
Company Revenue: $4.3 M per year
Core Services Provided: Advanced threat protection, compliance management, critical asset protection, cybersecurity risk management, security operations, and industries.
Established in the year: 1999
SecureWorks is a leading MSSP vendor focused on cybersecurity. They have a Counter Threat Platform (CTP) through which advanced data analytics, as well as security insights, are delivered. They offer 24*7 security services for expanding the network perimeter.
SecureWorks provides the following solutions:
- Enterprise network monitoring: Comprised of Advanced Malware Detection & protection (AMDP), Managed Firewall, Managed IDS/IPS, iSensor, etc.
- Endpoint Security: Encompassed of Advanced Endpoint Threat Detection (AETD), Enhanced Endpoint Threat Prevention (AETP), Supervised Server Protection, etc.
- Vulnerability Management: Advanced Vulnerability Scanning, Managed Web application scanning, Managed policy compliance, PCI Scanning, Vulnerability threat prioritization.
- Security Monitoring: Comprised of Log management.
- Combined Solutions: Comprised of managed detection and response.
Website: https://www.secureworks.com/
#4) IBM

Company size (employees): 4,00,000 plus
Locations: 170 + countries
Company Revenue: $79.139 billion (USD) per year
Core Services Provided: Cloud Computing, Business Consulting, Technology services, financing, industry expertise, training & skills.
Established in the year: 1911
IBM is again one of the leaders as per the 2018 Gartner Magic Quadrant for Worldwide Managed security services.
IBM provides the following Managed Services:
- Firewall management
- Vulnerability scanning from IBM Security.
- Information event management
- Intelligent log management on the cloud.
- Intrusion detection and prevention system management.
- Managed data protection services for Guardium.
- Endpoint security services
- IBM X-Force cloud security service
- Amazon GuardDuty services
- Security SD-WAN
- Unified Threat Management
- Technology Bundle
- Security intelligence analyst
- Security-rich web gateway management
Website: https://www.ibm.com/in-en/
Further Reading => List of the BEST Browser Security Solutions
#5) Verizon

Company size (employees): 155,400+ employees
Company Revenue: $ 129.6 B+ billion (USD) per year
Core Products & Services Provided: Mobility, Internet of Things, Networks and Internet, IT solutions and Cloud, Business communications, Security
Established in the year: 2000
Verizon’s security services solution protects the assets around-the-clock from security threats. This solution is flexible and can be customized according to your needs.
Following are the services provided by Verizon:
- Round the clock security expertise.
- A quick review of incident information.
- Data analysis with log management.
- In-depth inspection of incident trends.
- Intelligence-driven security monitoring and analysis.
Website: https://enterprise.verizon.com/en-au/?cpur=1
#6) Symantec
Company size (employees): 10000+ employees
Company Revenue: $2 to $5 billion (USD) per year
Core Products & Services Provided: Integrated Cyber Defense, Advanced Threat Protection, Information Protection, Endpoint Security, Email Security, Network Security, Cloud Security, Cybersecurity Services.
Established in the year: 1982
Symantec provides the following solutions:
- Continual 24*7 advanced threat monitoring.
- DeepSight intelligence
- Incident response services.
- Indicators to detect advanced persistent threats.
- Retroactive log analysis.
#7) Trustwave

Company Name: Trustwave (Chicago, Sao Paulo, London, and Sydney)
Company size (employees): 1001 to 5000 employees
Company Revenue: $190.4 M (USD) per year
Core Products & Services Provided: Threat management, vulnerability management, compliance management, network security, content & data security, endpoint security, security management, database security, application security.
Established in the year: 1995
Trustwave provides the following services:
- Threat Management: This covers managed threat detection, managed SIEM, managed two-factor authentication, managed UTM, managed Email security, SSL service lifecycle management, incident response & readiness, etc.
- Vulnerability Management: This covers managed security testing, application scanning, managed Web application firewall, network vulnerability scanning, database & big data scanning.
- Compliance Management: This covers Risk Assessment, PCI compliance, security awareness, security awareness education, etc.
Website: http://www.trustwave.com/
#8) AT&T

Company size (employees): 10000+ employees
Company Revenue: $10+ billion (USD) per year
Core Products & Services Provided: Mobility Services, Network services, Internet of things, voice & collaboration, cybersecurity services, cloud services, Wi-Fi, DIRECTV for Business.
Established in the year: 1983
AT&T Security Services aid in identifying, preventing and alleviating the loss caused by cyber-attacks and business interruptions.
AT&T security services include:
- Internet protection
- DDoS Defense
- Private Intranet Protect
- Mobile Security
- Firewall Security
- Network-based firewall
- Web application firewall
- Intrusion detection/prevention service
- Secure email gateway
- Endpoint security
- Web security service
- Premises-based firewall
- Encryption services
- Token Authentication services
- Security analysis and consulting solutions.
#9) BT

Company size (employees): 10000+ employees
Company Revenue: Unknown / Non-Applicable
Core Products & Services Provided: Fixed line services, networked IT services, broadband, mobile, TV products & services.
Established in the year: 1846
BT provides the following robust services:
- DDoS Protection to ensure denial of service mitigation.
- Next-generation Managed Firewall.
- SEM (Security event Monitoring) to assure real-time threat monitoring.
#10) Wipro

Company size (employees): 10000+ employees
Company Revenue: $5 to $10 billion (USD) per year
Core Products & Services Provided: Analytics, Applications, Business Processes, consulting, cloud & Infrastructure services, product engineering, etc.
Established in the year: 1945
Wipro offers a resilient, cost-efficient, and business-aligned security service called ServiceNXT.
Given below are the services offered by Wipro:
- Unified Threat Management
- Managed Authentication
- Identity and access management
- PKI operations
- Security Operations
- Security Monitoring
- Compliance reporting and management
#11) BAE Systems

Company size (employees): 10000+ employees
Company Revenue: $10+ billion (USD) per year
Core Products & Services Provided: Future technologies, aircraft, vehicles, surface ships, cybersecurity and intelligence, electronics, engineering services, information management, financial services, HR services, and commercial services.
Established in the year: Unknown
BAE offers the following services:
- Complete Security Monitoring
- Security Event Monitoring
- Managed Detection and Response (MDR)
- Compliance Monitoring
- Security Device Management
- Endpoint Monitoring with Host Agent
- Endpoint Detection & Response through Host Agent
- Business Defense Assessment
#12) CenturyLink

Company size (employees): 10000+ employees
Company Revenue: $10+ billion (USD) per year
Core Products & Services Provided: Internet & networking, Hybrid IT & Cloud, Voice & Unified Communications, Security, Managed & IT services.
Established in the year: 1930
CenturyLink services include:
- Device management
- Network and cloud-based security.
- Threat intelligence and predictive analysis.
- Incident response and recovery.
#13) Anomalix

Company Name: Anomalix (Chicago, US)
Headquarters of Anomalix is in Chicago. Anomalix provides its services to small, medium and large enterprises. Industries to which Anomalix provides its services include Finance Healthcare, manufacturing, technology, energy, education, and government.
Employees: 21
Locations: US
Core services: Managed all Security Services
Other services: Managed Identity Services.
Revenue: $ 3.5 Million
Features
- It can protect your network, data, application, cloud, and platform and can provide endpoint protection.
- For the well-known threats, a daily analysis will be done.
- It can detect and remediate malware and ransomware.
- It provides 24*7 protection.
Pricing Information: Contact them for pricing details.
Website: https://www.anomalix.com/
#14) Intrust IT
Company Name: Intrust IT (Ohio, US)
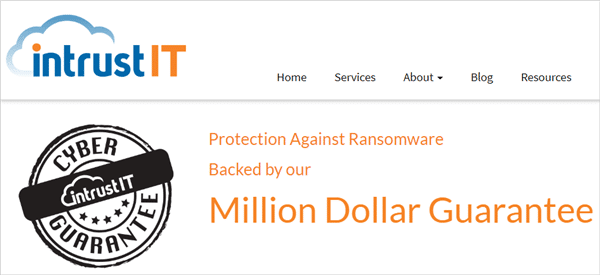
Headquarter of Intrust IT is in Cincinnati, Ohio, US. It provides solutions for small and medium-sized businesses. Intrust IT provides managed services for wireless networking, network and server support, technology consulting and many other requirements as well.
Employees: 43
Locations: US
Core services: Managed all type of security services
Other services: Wireless networking, On-site IT Support, Technology consulting, network and server support, etc.
Revenue: $3.7 M
Features
- They have monthly plans.
- It provides endpoint protection.
- Protects against Ransomware.
- They provide a guarantee to recover data.
Pricing Information: Contact them for pricing details.
Website: https://www.intrust-it.com/
#15) Foresite

Company Name: Foresite (Kansas, US)
Foresite has offices in the US and UK. Foresite provides managed security and cyber consulting compliance services. Industries to which it provides solutions include Legal, Insurance, Financial, Retail PCI, Healthcare, and education.
Suggested Read => Best Internet Security Suits of the Year
Employees: 20
Locations: US and UK.
Core services: Managed security
Other services: Cyber consulting compliance services.
Revenue: $2.9 M
Features
- Provides attack prevention policies.
- Tries to prevent the attack in the network.
- Gathers all the information about the attack—like ‘how it will affect the business?’ and ‘how the damage can be avoided?’
- You can define your own policies.
- It helps in detecting malware.
Pricing Information: Contact them for pricing details.
Website: https://foresite.com/
#16) Trustnet

Company Name: TrustNet (Atlanta, US)
TrustNet was launched in 2003. It is headquartered in Atlanta, US. It provides its solutions to both mid and large businesses. It provides its solutions to many industries and public & private organizations.
Employees: 50
Locations: US
Core services: Managed Security.
Other services: Penetration testing, Cybersecurity risk, Incident Response & Cloud security.
Features:
- They provide security monitoring.
- You can manage the log.
- There is a facility for threat management.
- They provide network security and vulnerability management.
Pricing Information: They have five plans:
- Entrepreneur: It starts at $750/month.
- SMB: Starts from $3375/month.
- Mid-Enterprise: Starts from $6250/ month.
- Enterprise: Starts from $18000/month
- Large Enterprise: Contact them for more details.
With each plan, you can add two facilities which include Wireless Intrusion and Detection.
Website: https://www.trustnetinc.com/
#17) TSC Advantage
Company Name: TSC Advantage (Washington, US)
TSC Advantage is providing security services for 10 years.
Its headquarter is in Washington. Another office is in Boston. Industries to which TSC Advantage provides services include Insurance, Financial, Government Security services, Healthcare, manufacturing, and Utilities.
Locations: Washington and Boston.
Core services: Cyber solutions
Other services: Many services for risk, compliance, and security.
Features:
- Provides Vulnerability Management. For this, it provides three options: TSC Operated. TSC Supported and Customer Managed.
- You can select an option based on your requirements.
- Reports and recommendations to improve security.
- TSC Advantage will help you improve the security at a reduced cost.
Pricing Information: Contact them for pricing details.
Website: https://tscadvantage.com/
#18) Global IP Networks

Company Name: Global IP Networks (Texas, US)
Global IP Networks was launched in 2000. It is headquartered in Texas, US. Global IP Networks provides many managed services. It provides services for data centers.
Employees: 24
Locations: Dallas and Plano
Core services: Data centers and managed security.
Other services: Datacenters
Revenue: $2.8 M
Further Reading => Top Data Center Infrastructure Management Software
Features
- It provides endpoint protection.
- Devices that are under security will get continuously monitored for threats.
- It provides 24*7 monitoring by tools and professionals.
Pricing Information: Contact them for pricing details.
Website: https://gipnetworks.com/business-it-security
#19) Cipher
Cipher is a global MSSP that provides tailored white-glove service to our customers around the world.
Best for Small, Medium, and Large Enterprises.
Services Provided: Cybersecurity Monitoring, Incident Management & Cyber Defense, Security Asset Management, Vulnerability & Compliance Management, Managed Application Security.
Established in the year: 2000
Industries: Credit Unions, Financial Services, Hospitality, Manufacturing, Healthcare, etc.
Credit: White glove customer service
Company Size: 300 employees
Company Revenue: $20 – $50 M range
#20) Andersen Inc.
Company Size: 3500+ employees
Company Revenue: $21 mln
Core Services Provided: Software Analysis with Automatic Means, Security Culture Establishment, IT Security Audit Services, Security Incident Solutions, Security Maintenance, Industrial Cybersecurity
Established in the year: 2007
Andersen’s secure software development practices (SSD) and QA are an important baseline for your digital product’s cyber security.
Andersen will apply code analysis tools to standard development operations to ensure your product source code is checked against best industry practices and the OWASP guidelines. Also, within continuous CI/CD routines, we will systematically tackle all risks stemming from open source libraries for transparent risk management.
Prominent clients: Samsung, Mercedes Benz, Ryanair, UNESCO, MediaMarkt, TUI, Paysera, Siemens
Book a free consultation with a price estimate with Andersen to analyze and discuss your needs concerning IT Security Services.
#21) ScienceSoft
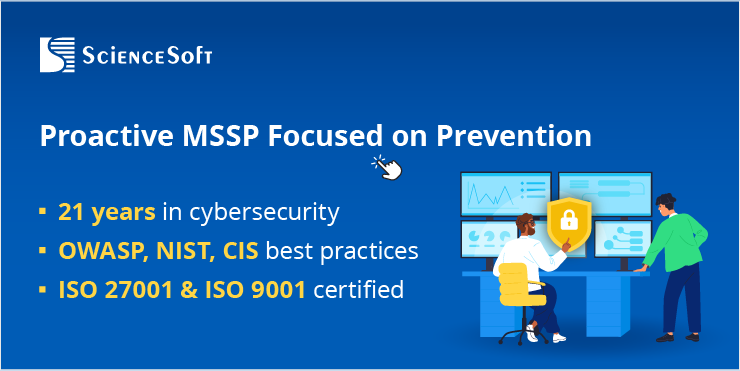
ScienceSoft is a cloud-centric, technology-agnostic MSSP with 21 years of experience in cybersecurity and 16 years in ITSM. For three consecutive years (2022–2024), the company has been featured in the Global Outsourcing 100 list by IAOP.
What makes ScienceSoft stand out:
- As a technology-agnostic MSSP, ScienceSoft is ready to work within the client’s existing IT infrastructure and implement a custom selection of best-fitting security tools. Since you will not have to adopt a particular security solution owned by the MSSP, you’re at a reduced risk of vendor lock-in.
- Reduced investments: ScienceSoft mainly uses cost-efficient and fast-to-deploy cloud security tools (e.g., by Azure, AWS) that do not require upfront capital investments from a client.
- Within its Prevent – Manage – Detect – Respond model, ScienceSoft takes a proactive approach to managed security and applies preventive measures to find and remove vulnerabilities before they can be exploited. At the same time, the vendor offers continuous (365 days a year) security monitoring and log analysis to ensure early threat detection and rapid incident response.
- Due to its mature, ISO 27001-certified approach to security management, ScienceSoft has not suffered a single data security breach in its history. This means your sensitive data is less likely to be exposed due to a cyberattack on the MSSP.
- The vendor has a dedicated SecOps approach for protecting fast-evolving applications and development infrastructure (e.g., in ecommerce, online services, SaaS).
ScienceSoft provides security and compliance consultants, cloud security specialists, Certified Ethical Hackers, and SIEM/SOAR experts who are ready to work as a fully self-managed team.
Company Size: 750+ employees
Company Revenue: $32 M (USD) per year
Established in the year: 1989
#22) UnderDefense
Company size: 110+ employees
Established in: 2017
Best for any sized business, from startups to large enterprises
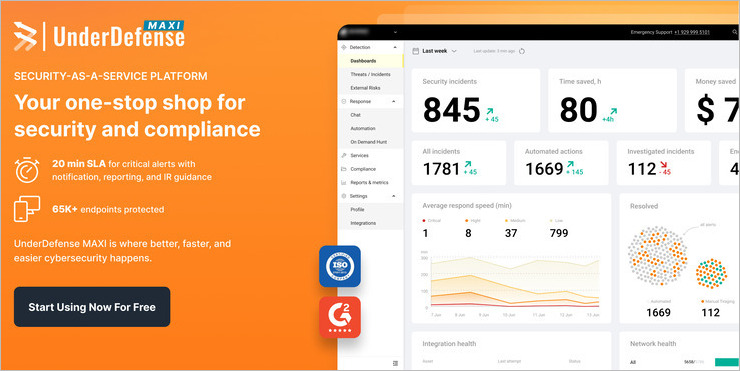
UnderDefense is an innovative cybersecurity provider that empowers companies to predict, prevent, detect and respond to the most advanced cyberattacks. The UnderDefense MAXI platform offers free certification kits, advanced MDR, and no-code security automation and orchestration. It allows businesses of all sizes and maturity levels to build reliable defenses across cloud, hybrid, and on-premise environments and scale them as they grow.
UnderDefense offers:
- A holistic solution to protect your business at every step of the way. UnderDefense MAXI is a holistic security-as-a-service platform that gets you covered at every step of the way. It unifies all your security tools within a single interface and makes security management radically simple and efficient.
- A security that never sleeps: our experts are always on. Threats don’t take a break, so our security team works non-stop to protect your business. We provide 24/7 monitoring and response to detect and defeat any threat quickly and efficiently.
- Simplified approach, amplified protection. Strengthen your security posture while minimizing the complexity, so you can focus on growing your business. Our proven approach makes cybersecurity accessible, intuitive, and more effective for businesses of all sizes.
- Maximizing your return on security investment. Every business should have access to top-quality cybersecurity, regardless of size or budget. That’s why we’ve developed a cost-effective solution that delivers robust protection against cyber threats.
Core services provided:
- 24/7 Managed detection and response
- Penetration testing
- Compliance
- Incident response
- Risk reduction
- Security-as-a-service
#23) SecurityHQ
SecurityHQ is a Global Managed Security Service Provider (MSSP), that monitors, detects, and responds to threats, instantly, 24×7.
Further Reading => Best Security Assessment Tools for MSSPs
Best for its tailored and simplified approach to fit client needs. SecurityHQ’s Managed Defense service provides security teams with visibility across all security controls and an enhanced user experience.
Company size (employees): They are supporting organizations with a team of 400+ experts (Level 1-4) on-demand around the globe.
Established in the year: 2003
How Does SecurityHQ Differ?
- Detection and Response Measures: SecurityHQ excels in this area, employing user behaviour analytics and endpoint detection and response to identify irregularities within systems and respond effectively.
- 6 Security Operation Centres (SOC) across the United Kingdom, The United States, the Middle East, India, South Africa, and Australia.
- Minimize alert fatigue, proactively detect, contextualize, and respond to incidents within 15 minutes of detection.
- Expert Team- Dedicated Team Available 24×7, From Onboarding, Throughout the Whole Process
- SHQ Response App: They are the only managed security service provider with the confidence to deliver their services via mobile app and desktop platform.
- Purely MSSP as a Core Business. SecurityHQ’s experts purely focus on enhancing their cyber security offerings.
Core Services Provided:
- Managed Defense: Managed Detection and Response (MDR), Managed Endpoint Detection & Response (EDR), Managed Defense for AWS, Managed Network Detection & Response (MNDR), and Managed Microsoft Sentinel.
- Managed Security: Managed Firewall, Threat & Risk Intelligence Services.
- Managed Risk: Vulnerability Management Service, Penetration Testing Service, CISO as a Service, Red Team Assessment.
Website: https://www.securityhq.com/
#24) Dataprise

At Dataprise, we offer premier Managed Cybersecurity solutions and support to provide you with the visibility, expertise, and technology necessary to stop attackers in their tracks.
Our comprehensive approach includes Managed Detection, Managed Response, Penetration Testing, and access to top-tier security analysts who can provide guidance and expertise as a virtual Chief Information Security Officer (vCISO).
Features:
- 24/7 Monitoring & Response: Lightweight and Powerful
- Elite Security Team: We Combine Expertise and Tools
- Visibility & Assessments: Uncover Hidden Threats
- Threat Intelligence: Stay Informed, Stay Secure
Founded in: 1995
Employees: 201-500 employees
Locations: Rockville, Washington, Northern Virginia, Baltimore, New York City, Boston, Dallas, Houston, Los Angeles, Corona, Chattanooga, and Boulder Colorado.
Core Services: 24×7 Help & Support Desk Cyber Security, IT Consulting & Strategy, Monitoring & Management, Cloud Services, etc.
Pricing Info: Contact us for a quote.
Additional MSSP Providers
#25) Delta Risk
Security services provided by Delta Risk are SaaS application security, cloud infrastructure security, network security, and endpoint security. It also provides many other security services like cybersecurity exercises and training.
It has offered its services to financial, healthcare, legal, public, retail and e-commerce industries. Delta Risk is headquartered in Texas. It has offices in Washington, Dulles, and King of Prussia.
#26) NTT Security
NTT Security is a subordinate company of Integralis AG. This company was headquartered in Germany.
NTT Security has offices in the US and EMEA. NTT Security is one of the best security service providers who offer Vulnerability management, Security to multiple devices, ESPS (Enterprise Security Program Services), Log monitoring and Threat detection services.
#27) QAlified

QAlified is a cybersecurity and quality assurance company specialized in solving quality problems by reducing risks, maximizing efficiency, and strengthening organizations.
Headquarters: Montevideo, Uruguay
Founded in: 1992
Employees: 50 – 200
Core Services: Application Security Testing, Penetration Testing, Vulnerability, Managed Security Services
An independent partner to evaluate software security with experience in different technologies for any type of software.
QAlified will help you to:
- Detect existing and potential vulnerabilities in your software.
- Perform professional security application analysis and code review.
- Prepare your software for a secure launch or upgrade.
- Respond to cybersecurity incidents and threats.
- Meet global cybersecurity standards.
A team of highly skilled cybersecurity professionals with experience in more than 600 projects in Banking, Insurance, Financial Services, Government (Public sector), Healthcare, Information Technology.
Conclusion
Information security is very crucial for any organization. All these managed security service providers whom we discussed here in this article provide top-notch services.
Apart from the above top MSS vendors, the other famous names in the area of MSSPs are DXC Technology, Atos, Capgemini, HCL Technologies, Orange Business Services, Fujitsu, etc.
However, being an IT manager, you need to pick one among the MSSPs in a diligent way by keeping in mind the tools, scale, and scope provided by the vendor’s managed security operations.


