Explore the top game-changing Infrastructure Monitoring Solutions to prevent downtime & optimize performance. Pick the right Monitoring Services to achieve complete visibility across the entire IT stack:
Frequent downtimes, sudden drops in website performance, or technical disruptions have long been a source of grief for businesses worldwide. These serious issues can threaten a company’s bottom line if not addressed swiftly and efficiently.
Tackling these issues is what infrastructure monitoring software does best. An infrastructure monitoring tool is a software solution tasked with gathering data and tracking the health of IT components across your cloud, on-premises, and hybrid environments.
Some of the best infrastructure monitoring solutions can help businesses gain end-to-end visibility into their entire IT stack and nip an issue before it compounds.
Table of Contents:
Infrastructure Monitoring Services & Solutions – Top Trending
There are many such software solutions out there. However, only a few deliver for overall functionality and usability. In this article, I’ll recommend those tools.
I’ve used all of them and they’ve impressed numerous users like me enough to earn a spot on this list.
[image source]
So, without much further ado, let’s get started.
Who is this article for?
An infrastructure monitoring software can benefit a plethora of professionals. Here are a few stakeholders that could find my article useful:
- Site Reliability Engineers
- DevOps Engineers
- Operations Teams
- Small to large-scale enterprises
- Businesses operating in compliance-centric industries
- IT teams
How did I choose Infrastructure Monitoring Solutions for this article?
To ensure you are making the right choice, I suggest paying heed to the following factors before you venture into your quest for the best monitoring tool.
#1) Data Visualization: A great monitoring software will prioritize user-friendliness and offer an interface that helps users view their entire IT stack in one place. Opt for tools with a central dashboard that visualizes monitoring data in a variety of ways.
#2) Extensive Data Collection: Go for a tool that gathers data comprehensively. They should collect data as logs, traces, user experience, and performance metrics from all components across multiple environments.
#3) Real-Time Monitoring: Today’s infrastructure monitoring tools must offer real-time insights into various aspects like disk space, latency, CPU usage, error rates, etc. Go for tools that alert you of an issue immediately.
#4) Customization: Customizable dashboards and alerting thresholds can make your experience using such monitoring tools very simple. Make sure the tool you choose allows you to customize its interface and thresholds as per the needs of your business.
#5) AI Capabilities: Numerous software nowadays are incorporating AI to improve their service quality. A tool that leverages intelligent AI or ML-based tools to predict issues or assess data trends can significantly streamline crucial monitoring and problem-detecting tasks.
#6) Security: Go for tools that adhere to robust security protocols. Such tools are known to handle an influx of massive data daily. So, make sure they comply with regulations as dictated by bodies like GDPR, SOC-2, and HIPAA.
#7) Integrations: A good monitoring tool offers seamless integration with a variety of third-party apps. I would suggest opting for software that integrates with your stack to get the desired results.

Expert Advice:
List of the Best Infrastructure Monitoring Solutions
- Paessler PRTG
- Site24x7
- LogicMonitor
- SolarWinds NPM
- ManageEngine OpManager
- Middleware
- Datadog
- NewRelic
- Zabbix
- Dynatrace
- AppDynamics
- Nagios XI
Comparing the Top Infrastructure Monitoring Services
| Name | Best for | Top Features | Price | Rating |
|---|---|---|---|---|
| Paessler PRTG | Customizable dashboard and reporting | Custom Monitoring, Server Monitoring, Firewall monitoring | It starts at $1934,10 for [License Size: 500 + 12 months maintenance] | |
| Site24x7 | Better troubleshooting with metrics, traces, and logs. | Customised dashboards & reports, auto detect anomalies, a d enhanced visibility. | Starts at $9 per month. | |
| LogicMonitor | 2000+ out-of-the-box integrations | VM monitoring, Server Monitoring, Remote Monitoring | Starts at $22 per resource per month | |
| Middleware | End-to-end visibility and customizable dashboard. | Custom dashboard, Kubernetes monitoring, Troubleshooting | Starts at $0.3 per GB metrics. | |
| Datadog | Machine-learning-based alerting system | Cloud Security, Data Collection, Auto-discovery | Starts at $15/host per month | |
| New Relic | Integration with 750+ relevant solutions | Health Map, Serverless Monitoring, Root Cause Analysis | Quote-based |
Detailed reviews:
#1) Paessler PRTG
Best for customizable dashboard and reporting.
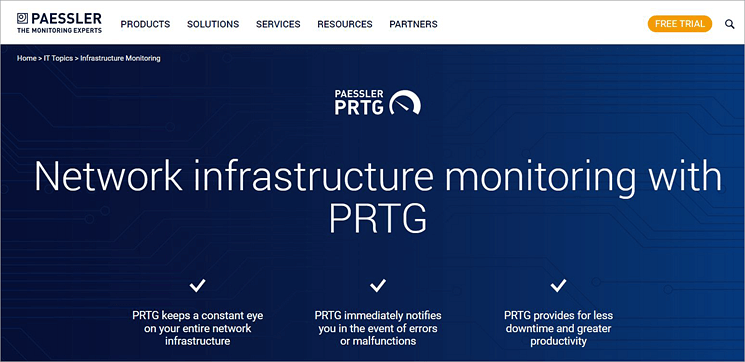
Kicking off our list is Paessler PRTG, a tool that is lauded among system administrators for its advanced infrastructure monitoring capabilities. You can use the software to monitor your entire IT infrastructure comprising bandwidth, VoIP services, servers, virtual environments, websites, and more.
The tool lets you set up and launch customizable notifications, which immediately alert you of any imminent infrastructure malfunctions. This helps your IT teams respond to an issue in a far more effective and efficient manner than usual.
By precisely locating detected issues, the tool significantly accelerates the troubleshooting process.
With the help of an intuitive network map, the tool points you toward the part that handles the error. Paessler also comes loaded with over 250+ pre-configured sensors that automate monitoring. You also have the privilege of creating custom sensors to monitor specific aspects of your IT stack.
Paessler PRTG also features an impressive central dashboard. It is easy to navigate and highly customizable. The dashboard alongside the real-time map does a great job of visualizing your entire network. Its deployment is also seamless. PRTG is available as an on-premises and cloud-based solution.
How Paessler PRTG works:
- Launch the PRTG software in your system.
- Make configurations based on what aspects of your infrastructure you wish to monitor.
- Deploy sensors to initiate monitoring.
- Collect and view data from monitored devices via the central dashboard.
- Set up custom alerts to get notified of errors as they pop up via email, SMS, or other communication apps.
Features:
- Distributed Monitoring: PRTG will help you monitor your entire IT infrastructure stack across multiple locations from a single location. All data is consolidated and presented via a centralized dashboard and an easy-to-read network map. There is no limit to the number of remote locations you can monitor.
- Customizable Alerts: You can set up custom alerts to get immediately notified of any detected error. You can also set up custom thresholds to control your monitoring. You can choose from a variety of built-in notification methods that include email, HTTP requests, SMS, etc.
- Custom Reporting: Reports generated by PRTG are quite comprehensive. You can customize the report templates as you deem fit. You get reports that convey the live status of elements on your IT infrastructure.
- Server Monitoring: You can rely on the software to monitor all sorts of servers on your infrastructure. This includes file servers, web servers, and email servers. This makes PRTG ideal for monitoring system uptime, performance, and memory capacity.
- Firewall Monitoring: PRTG ensures robust firewall monitoring for enhanced network security. It monitors all incoming and outgoing traffic and also keeps an eye on your network’s firewall. You are immediately alerted of a possible firewall breach.
Why I Like It?
Featuring an easy-to-read network and customizable dashboard, PRTG is an expert at visualizing even the most complex IT infrastructures. Its deployment is seamless, and its subscription plans are quite flexible.
Pros:
- Highly customizable
- Multiple user interfaces
- Easy-to-read network map
- Over 250+ pre-configured monitoring sensors.
Cons:
- Nothing significant
Our Review: Paessler PRTG is adored by system administrators and IT teams worldwide and for good reason. It arms you with all the tools you need to optimize your entire infrastructure and keep it running without any issues.
Thanks to its central dashboard, you’ll be able to keep an unwavering eye on your entire network infrastructure across multiple remote locations. You receive an immediate alert if there’s an error.
Price: Paessler PRTG offers the following subscription plans based on how many aspects of a device in your network you want to be monitored:
| License size | Price |
| 500 + 12 months maintenance | $1934,10 |
| 1000 + 12 months maintenance | $3509.10 |
| 2500 + 12 months maintenance | $7289.10 |
| 5000 + 12 months maintenance | $12779.10 |
| XL1 + 12 months maintenance | $16109.10 |
A free trial and demo are available upon request.
#2) Site24x7
Best for Better troubleshooting with metrics, traces, and logs.
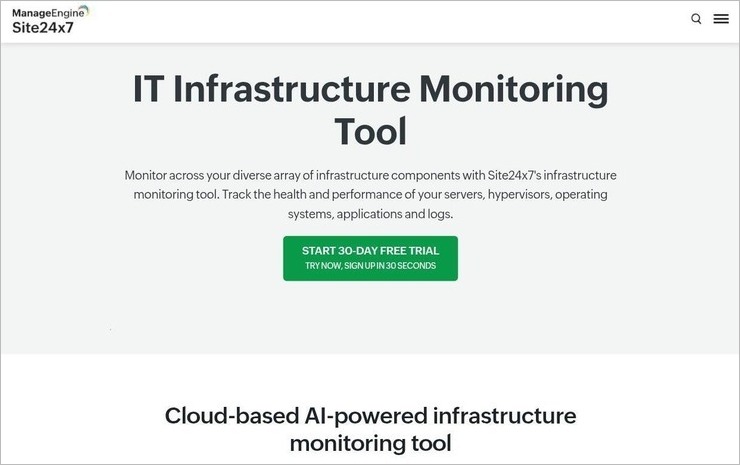
Site24x7 is a cloud-based AI-powered infrastructure monitoring tool that helps you in monitoring a diverse range of infrastructure components of your organisation. It also helps in tracking and managing the performance of servers, hypervisors, operating systems, applications and logs.
Under infrastructure monitoring it includes Better troubleshooting with metrics, traces, and logs and enhanced visibility to overcome infrastructure monitoring challenges within a single console.
With the help of metrics what if provides you can forecast your infrastructure performance, create customised dashboards and reports, integrate with a wider variety of ITSM and collaboration tools, and also auto detect anomalies and autocorrect them with IT Automation
Features:
- Enhanced visibility: Provides enhanced visibility into different components of the infrastructure including servers, hypervisors, operating systems, applications and logs.
- Infrastructure performance forecast: With the help of artificial intelligence and machine learning it can predict the infrastructure performance and capacity to help you in optimizing resource allocation and capacity planning.
- Wider scope of integration: It supports an extension range of ITSM and collaboration tools. It includes Slack, Jira, PagerDuty, Zapier, and so much more.
- Customisable dashboards: It enables you to create custom dashboards to view key performance indicators.
- Auto Detection of anomalies: It automatically detects anomalies and repairs them with AIOps.
- Better troubleshooting: It facilitates better troubleshooting with metrics, traces, and logs.
Pros:
- Out-of-the-box plugin extensions.
- Predictive analysis.
- Capacity forecast
- Anomaly detection.
- Automation
- Instant alerts.
Cons:
- Overalerting on larger outages.
- Complex setup.
Our Review: One can surely select site24x7 for their organisation’s infrastructure monitoring needs as it supports all essential features needed for the same. It includes auto detection of anomalies, autocorrection of anomalies with IT automation, customised dashboards & reports, enhanced visibility into different aspects of infrastructure and so on.
Price:
- Infrastructure monitoring starts with $9 per month.
- A 30-day free trial is available.
#3) LogicMonitor
Best for 2,000+ out-of-the-box integrations.
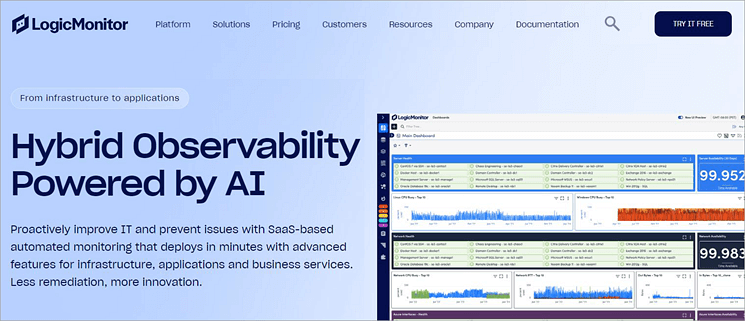
LogicMonitor has been a major player in the network monitoring landscape for a while now and has earned itself a loyal user base. It does what a good infrastructure monitoring tool should do, which is to help companies gain comprehensive visibility into their infrastructure’s topology and performance.
The tool is excellent at rectifying any visibility gaps with the help of intuitive topology mapping and anomaly detection.
LogicMonitor stands out for relying on agentless monitoring. LogicMonitor utilizes its agentless collectors to easily discover new devices and configurations on the infrastructure. The data gathered from these elements is then automatically correlated to solve issues and optimize the IT environment.
Like PRTG and Middleware, LogicMonitor also lets you set up custom alert thresholds. These alerts can accurately detect an issue and know how to identify false positives. The tool provides you with advanced insights into metrics, including resource utilization. Simply put, LogicMonitor warns you of an imminent issue so you can address it before the situation compounds.
LogicMonitor’s alerting system can be further enhanced, thanks to over 2000 out-of-the-box integrations with prominent ticketing and workflow systems.
How LogicMonitor works:
- Install the agentless collectors on a host within your infrastructure.
- Once installed, these collectors will gather data, encrypt it, and send it to LogicMonitor’s servers via SSL connection.
- View the processed results via LogicMonitor’s central UI.
Features:
- Server Monitoring: You can count on LogicMonitor to monitor the health and performance of your entire server infrastructure. The tool automatically detects and alerts you on CPU, Network, Memory, and OS metrics. You can also gain complete visibility into your SQL server infrastructure with this platform.
- Remote Monitoring: You can use LogicMonitor to monitor SaaS applications that are mostly used by your remote workforce. This includes web conferencing apps, VPNs, engineering services, etc. It will visualize all your devices, regardless of where they are located.
- VM Monitoring: LogicMonitor facilitates exceptional virtual machine monitoring. You are guaranteed in-depth agentless monitoring of your entire virtualization stack in public and private clouds and your data centers. The tool facilitates the auto-discovery of virtual machines.
- Database Monitoring: Once launched, LogicMonitor will instantly start monitoring all your databases. LogicMonitor’s built-in alerting and querying capabilities help optimize the performance of your databases. It can auto-discover the device type and database with ease with the hostname alone.
- Storage Monitoring: You can rely on LogicMonitor to discover in-depth details about industry-leading storage systems. The tool can monitor and graph the health and performance of all storage systems without hassle. You’ll know exactly when a storage system is prone to failure so your team can act accordingly.
Why I like it?
Like the best infrastructure monitoring tools out there, LogicMonitor is easy to use, super fast, and effective in its ability to optimize the health and performance of your infrastructure. It stands out for facilitating more than 2,000 out-of-the-box integrations.
Pros:
- Out-of-the-box integrations
- Intelligent alerting system
- Pre-built dashboards
- Role-based access controls
Cons:
- Only available as a SaaS infrastructure monitoring tool.
Our Review: While the absence of an on-premises solution will irk some users, LogicMonitor is still a strong infrastructure monitoring tool based on its user-friendliness and speed. It can be used to facilitate proactive out-of-the-box reporting across more than 2,000 hybrid technologies. This alone makes the tool worth a mention on this list.
Price: LogicMonitor’s infrastructure monitoring plan starts at $22 per resource per month. A free trial and demo are available upon request.
Website: https://www.softwaretestinghelp.com/top-logicmonitor-competitors/
Check our Detailed Review of LogicMonitor Competitors
#4) SolarWinds NPM
Best for multi-vendor network mapping.
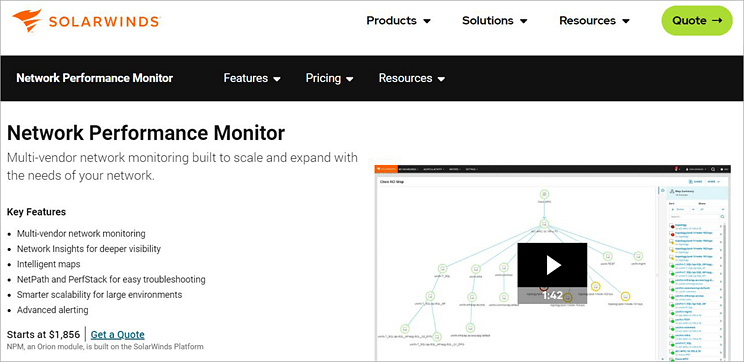
SolarWinds NPM is another tool that impressed me with its advanced features. One of its best features is auto-discovery. It is one of the infrastructure monitoring services that gets to work immediately after being deployed. It will auto-discover all paths and nodes in your network using a variety of protocols.
You are also provided with a ton of performance metrics, especially on clients, wireless controllers, and access points. The tool facilitates node-to-node visualization with intuitive mapping and troubleshooting. The metrics themselves are customizable and can be tailored according to your team’s needs.
Features:
- Visualization: The software will automatically visualize your entire network upon the network. This visualization helps you accurately pinpoint where an issue has occurred. You have the option to manually visualize your infrastructure as well.
- Auto-Discovery: The software automatically discovered all network nodes, paths, and components. You get a bird’s eye view of your entire network across vendors and devices.
- Metrics Assessment: You are armed with various performance metrics for proper and accurate issue detection. The metrics can be customized as per your team’s needs. For instance, you can build drag-and-drop graphs and charts for easier comprehension.
- Network Troubleshooting: The troubleshooting on SolarWinds NPM is fast and efficient. You get an in-depth insight into an identified error. You are alerted instantly as an error pops up.
- Extensive Coverage: Nearly every type of network feature can be monitored using this software. You get extensive coverage across cloud, on-premises, and hybrid environments. You’ll be able to view critical devices across vendors.
Pros:
- Customizability
- Highly scalable
- Extensive network mapping
Cons:
- Better support could improve the tool even more.
Our Review: While many of its users find the support disappointing, SolarWinds NPM is widely appreciated in all other departments. Everything from its alerting system to mapping capabilities is praiseworthy. As such, it more than deserves a mention on this list.
Price: SolarWinds NPM subscription plan starts at $1,856. A perpetual license for the tool will cost you $3,592. You can contact the SolarWinds team for a free demo or a custom plan.
Check our Detailed Review of SolarWinds NPM Alternatives
#5) ManageEngine OpManager
Best for AIOps-driven approach.
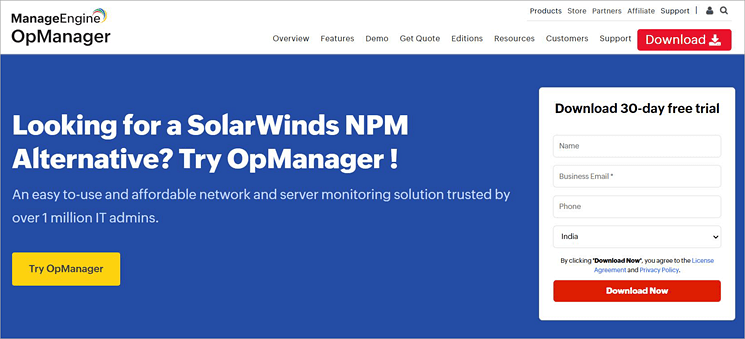
ManageEngine OpManager earns a spot on this list because of its advanced network monitoring features. This is a tool that’ll help you keep an unwavering eye on your network across multiple environments with over 2,000 performance metrics. It also stands out for featuring an easy-to-use central dashboard.
OpManager helps you gain insight into performing all components on your network. For instance, you can rely on the software to gain critical information on the performance of your routers in real-time.
You can also leverage the tool’s automatic network mapping capabilities to pinpoint what area of your network is suffering from outage or performance degradation.
Features:
- Server Management: OpManager will help you monitor servers across multiple OS vendors. It can monitor both physical and virtual servers. The platform also facilitates Process, Hyper-V, and VMware monitoring.
- Fault Management: You are instantly alerted in the event of any fault detected. You can then create and automate first-level troubleshooting steps. The tool is excellent at root cause analysis as well.
- Storage Management: The software assesses historic and current usage trends related to storage capacity. You get deep insights into the performance, capacity, and configuration of various RAID controller devices. The tool can also be used for tape library and fabric switch management.
- AIOps: OpManager’s AI ensures precise forecasting with accurate reports. Usage trends are identified proactively. Resource crunches are also predicted accurately by the software.
- Data Center Management: The software proactively monitors your IT systems, like routers and servers, upon launch and can create a replica of your data centers in 3D, all via a single web console.
Pros:
- Intuitive web console
- Accurate reporting and trend forecasting
- Over 2,000 performance metrics to rely on
Cons:
- Configuring policies can be tough for some users.
Our Review: OpManager comes loaded with some of the most advanced network monitoring features. It stands out for its AI-driven reporting and built-in fault management system. The tool is ideal for IT teams who wish to fix issues with their infrastructure at a faster pace.
Price: OpManager’s subscription starts at $95. You can request a custom quote based on your specific requirements. A free demo and a 30-day free trial are also available upon request.
Read Our Review of ManageEngine OpManager Alternatives
#6) Middleware
Best for end-to-end visibility and customizable dashboard.
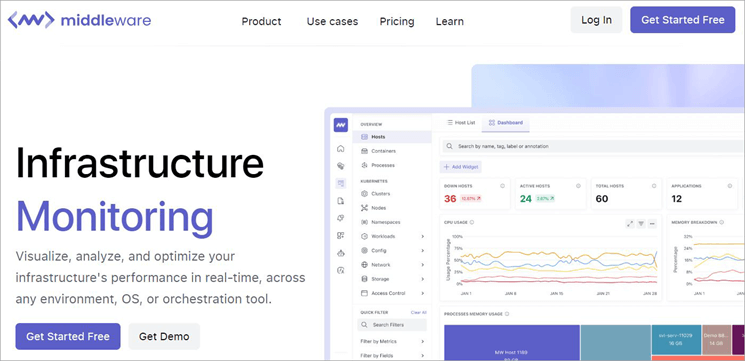
Middleware is yet another infrastructure monitoring platform that performs just as well as Paessler PRTG. As an infrastructure monitoring tool, you can count on Middleware to gain deep insights into the performance of your entire network infrastructure in real-time.
The tool visualizes your infrastructure, thus making it easier for your IT team to analyze and optimize its performance.
A stand-out aspect of Middleware is the end-to-end visibility it offers. Once launched, you get a comprehensive list of all hosts running within your infrastructure. The metrics provided include memory usage, CPU usage, and resource status. You get to monitor thousands of metrics similar to these.
Another area where Middleware shines is in customization. You can customize your monitoring experience as per your requirements. Everything from the dashboard to alert thresholds can be customized. For instance, you can create a custom dashboard with the specific purpose of monitoring host performance.
Troubleshooting an issue is also very simple with Middleware, thanks to one-click correlation traces, logs, and metrics.
How Middleware works:
- Download and install the software on your system.
- Middleware’s agent then gathers monitoring data.
- Middleware’s backend engine processes the data.
- View the result via Middleware’s unified dashboard.
Features:
- Data Ingestion: Middleware stands out from many of its contemporaries for offering controllable data ingestion. You can control the ingestion by turning the metrics on and off or remove unnecessary metrics to expedite issue resolution.
- Troubleshooting: You can rely on Middleware to quickly troubleshoot any issue with a one-click correlation of logs, traces, and metrics. The software expedites troubleshooting from drilling down to any related metrics, logs, services pods, etc. You are then presented with historical records, which go as far back as 6 months.
- Customizable Dashboards: Like PRTG, Middleware also allows you to customize the dashboard to serve your specific goals. You can get a default dashboard to monitor each infrastructure component for VMs, containers, cloud-hosted machines, etc.
- Kubernetes Monitoring: The software makes it easier to monitor the performance of Kubernetes pods, clusters, and nodes. You can set up a default dashboard that can monitor the performance metrics for Kubernetes.
- Custom Alerting: The software allows you to create alerts for any performance metric. Middleware sends you accurate alerts in real-time. You can customize the alert threshold per your needs.
Why do I like it?
Deployment is easy and usage is simple. Middleware is a tool that doesn’t require a steep learning curve. Plus, the tool is highly customizable. Everything from alert thresholds to the look of its UI can be customized based on your needs.
Pros:
- Easy to deploy
- Intuitive UI
- Customizable monitoring
- Free forever plan available
Cons:
- Nothing significant
Our Review: Middleware comes loaded with advanced monitoring features that are essential to optimizing the performance of your infrastructure. You are granted end-to-end visibility into your entire stack with real-time insights. This, along with rapid troubleshooting, makes this software great at monitoring complex infrastructures.
Price: Middleware offers the following subscription plans:
- The pay-as-you-go model will cost you $0.3 per GB metric.
A custom and a free forever plan is also available. You can also request a free demo.
Website: https://middleware.io/product/infrastructure-monitoring/
#7) Datadog
Best for Machine-learning-based alerting systems.
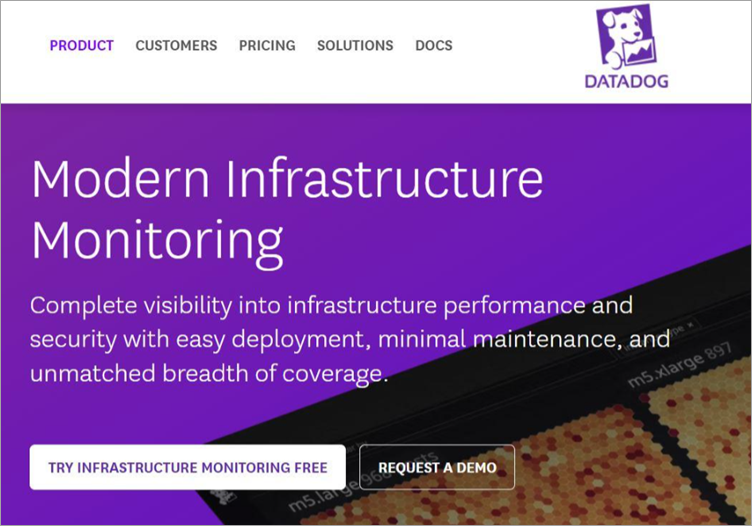
Datadog is another infrastructure monitoring tool that distinguishes itself with robust, modern features. The tool is excellent at analyzing complex IT infrastructures, thanks to tag-based search and analytics. The platform considerably simplifies monitoring and troubleshooting by automatically identifying accurate issues and separating them from false positives.
It can do so by using advanced machine-learning-based tools. You also gain end-to-end visibility into your entire IT stack using the software. It helps you track thousands of infrastructure-related metrics with ease. It also provides you with historical data. You get data on infrastructure that doesn’t exist in your organization as well.
As I mentioned, troubleshooting is also simple via Datadog. The platform expedites this process with the one-click correlation of related logs, traces, metrics, and security signals.
Datadog’s UI is also one of its strongest qualities. It doesn’t require any scripting or querying knowledge, so anyone can use it. We promise seamless deployment across on-premises, IoT, and hybrid environments.
Features:
- End-to-End Visibility: Like the best infrastructure monitoring services out there, Datadog grants you deep visibility into your IT infrastructure stack. You can even access data pertaining to infrastructure that doesn’t exist anymore. There are thousands of out-of-the-box metrics to help you monitor the performance of devices on your infrastructure.
- Metrics Assessment: The platform lets you decide which metrics to focus on and which ones to ignore. Tt also preserves the mathematical accuracy and granularity of all your queries.
- Data Collection: The platform is excellent at gathering data on all monitored devices in your infrastructure. You get globally accurate percentiles. You’ll know exactly what impact each process running on your stack has.
- Cloud Security: The tool performs continuous configuration checks to enhance your infrastructure’s security posture. It also helps meet audit requirements as dictated by over 15 compliance frameworks. This includes frameworks like HIPAA, DSS, GDPR, etc.
- Auto-Discovery: Datadog starts proactively monitoring upon launch. It relies on advanced machine-learning-based tools to surface real issues. The discovery of the issue is automatic, thus making the tool very simple to use.
Why do I like it?
Datadog’s service is marked by a simple deployment process that requires little to no maintenance. Additionally, we promise deeper visibility into your cloud and hybrid environments. It especially stands out for its alerting system that’s backed by advanced machine-learning-based tools.
Pros:
- Intuitive UI
- Real-time monitoring
- Free plan available
- Out-of-the-box metrics
Cons:
- More suited for advanced users
Our Review: Datadog’s monitoring capabilities ensure you get unparalleled coverage of your entire IT infrastructure. With seamless deployment, an intuitive UI, and several out-of-the-box performance metrics to offer, this is one of the best infrastructure monitoring tools out there.
Price: Datadog HQ offers the following plans:
- Infrastructure: starts at $15/host per month
A free plan is available. A free demo and trial are also available upon request.
Website: https://www.datadoghq.com/product/infrastructure-monitoring/
#8) New Relic
Best for integration with 750+ relevant solutions.
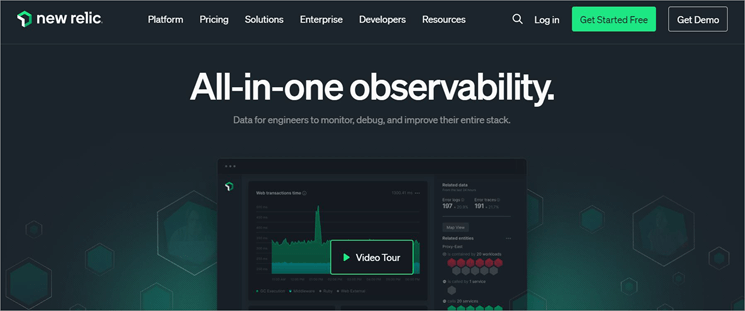
With New Relic, you get one of the best cloud monitoring tools that impeccably blends the capabilities of infrastructure and application performance monitoring.
As expected from such tools, you can use New Relic to assess, optimize, and troubleshoot your entire IT stack. The tool brilliantly visualizes connections between infrastructure and app performance.
This helps IT teams quickly identify an issue and take measures to fix it. It comes loaded with all the features that are typical of a network monitoring tool. It offers alerts in real-time and is also quite exceptional in incident management as well as server-less monitoring. You are immediately alerted of any system failures.
New Relic also gathers telemetry data as traces, logs, and metrics and presents the results through a built-in log management UI. Where New Relic makes its mark is in the integration department. It facilitates strong integration with multiple prominent software solutions.
These include Terraform, WordPress, Azure, MySQL, and over 750 other tools. New Relic features an intuitive dashboard and a health map through which it can visualize the performance of your stack.
Features:
- Real-Time Alerts: It is easy to set up alerts with New Relic. Alerts are sent immediately in the event of a potential infrastructure failure or when an anomaly is detected. This gives IT teams the opportunity to act faster.
- Health Map: New Relic visualizes the performance of your entire stack across on-premises and cloud environments. Information is provided in the form of comprehensive charts and graphs. This makes it easier for users to gauge the health of devices on your network.
- Root Cause Analysis: New Relic is considerably effective at troubleshooting issues because of its ability to perform root cause analysis. You can rely on the tool to find the root cause of any problem. This helps you take measures to prevent the problem from ever coming back.
- Serverless Monitoring: This is one of New Relic’s strongest USP. New Relic completely takes on the responsibility of managing servers so your team can focus on other core issues. With New Relic at the helm, your IT team can focus on fixing performance issues that are critical to maintaining optimal system health in serverless computing.
- Impact Quantification: New Relic can help you assess the impact of deploying certain apps. It will help you constantly monitor the host and configuration changes. This also helps you identify relationships between different entities on your network to pinpoint an issue faster.
Why I like it?
New Relic’s more than 750+ integrations made a distinct impression. It is also great to visualize your entire stack through an intuitive health map. Plus, its user-based pricing is quite enticing.
Pros:
- Robust integrations
- Visualize data across apps and infrastructure
- Consumption-based pricing
- Embedded change tracking
Cons:
- Some users have complained about customer support being unresponsive.
Our Review: New Relic seamlessly integrates the best capabilities of infrastructure and application monitoring to troubleshoot almost any sort of issue in no time. It is great at drawing a connection between infra and deployed apps. The platform presents you with a clear picture of your entire system’s health.
Price: Contact the New Relic team for a custom quote. A free demo is available upon request.
Website: https://newrelic.com/platform/infrastructure
#9) Zabbix
Best for distributed monitoring and unlimited scalability.
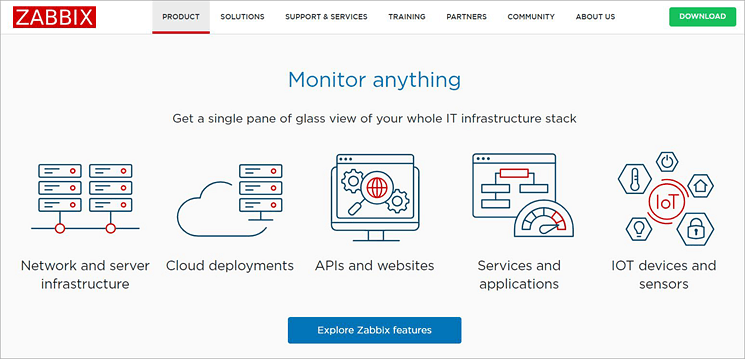
As an infrastructure monitoring tool, Zabbix can go toe-to-toe with some of the best software solutions in the industry. The software does what all good infrastructure monitoring solutions should do: it helps you gain complete visibility into your entire IT infrastructure stack.
You’ll get a single view of everything from APIs and websites to networks and servers within your infrastructure. Zabbix is perhaps best known for its scalability. From multi-tenant enterprise environments to smart homes, Zabbix can be scaled according to the needs of any infrastructure.
Deploying the tool is also quite seamless. You’ll be able to deploy and scale a Zabbix infrastructure from the central UI with native encryption between various components.
Features:
- Flexible Metric Collection: Once launched, you can count on Zabbix to collect metrics from any source. The process of gathering data is highly flexible. This means you can customize the process as you deem fit.
- Agentless Monitoring: Zabbix leverages agentless monitoring to facilitate remote monitoring. The software supports a wide range of remote monitoring protocols. It can help you with Java application monitoring, web monitoring, ODBC monitoring, etc.
- Smart Thresholds: Zabbix will help you define smart problem thresholds. Once defined, the platform will detect problem states within the incoming network flow automatically. You are guaranteed high-performance, real-time problem detection.
- Advanced Alerting: Zabbix can send you alerts using multiple communication channels. You can also customize the alert messages and define different messages for different channels.
- Data Visualization: Zabbix can display data from your monitored infrastructure in a variety of ways. You can get your data visualized in the form of comprehensive graphs, geo-maps, widgets, etc. This visualization allows you to access key data related to your infrastructure in just a single click.
Why I like it?
Zabbix comes with many distinct features. One that stood out to me was its widget-based dashboard, which helps you visualize your infrastructure in many different ways. The software is also scalable to any infrastructure.
Pros:
- Widget-based dashboard
- Excellent problem detection
- Customizable
- High scalability
Cons:
- Some users may experience a steep learning curve initially.
Our Review: Zabbix promises exceptional distributed monitoring and problem-detecting capabilities. It helps you gain visibility into your entire IT infrastructure stack in a single view. Plus, it is highly customizable and scalable.
Price: Contact the Zabbix team for a custom quote. A free demo is available upon request.
Website: https://www.zabbix.com/
#10) Dynatrace
Best for automation powered by AI.

Dynatrace distinguishes itself from many of its contemporaries by utilizing AI. This AI is responsible for the automation that Dynatrace has become known for in recent times by considerably automating several key aspects associated with infrastructure monitoring. Once launched, Dynatrace’s AI will continuously monitor your infrastructure.
It can detect issues accurately and steer clear of any false positives. Besides this, you can also count on Dynatrace to monitor and assess the performance of applications on your infrastructure. Dynatrace’s platform is also highly customizable. It can be tailored and extended to fit the needs of your unique environment.
Features:
- Automation: Dynatrace is powered by a casual AI known as Davis. This AI automates various problem detection and monitoring tasks. Thanks to this, Dynatrace facilitates continuous infra monitoring and proactive issue resolution.
- Automated Context and Causation: Dynatrace arms its users with intuitive analytics and facilitates AI-driven, root-cause analysis. This helps the software retain the context of the data it ingested. This method is a welcome alternative to error-prone and tedious tagging.
- Robust Integrations: Dynatrace ensures robust integrations, especially with a variety of automation platforms and remediation tools. These integrations help the software perform a variety of functions. These include auto-remediation, real-time CMDB updates, etc.
- Real-Time Insights: Dynatrace provides its users with monitoring, security, and business analytics. There are no schemas or storage tiers to manage. You get insights into everything transpiring within your infrastructure in real-time.
- Visualization: Like the best tools on this list, Dynatrace can also visualize data for you in a variety of ways. It can easily visualize dynamic environments that include services, virtualization networks, and hosts.
Pros:
- AI-driven insights
- Continuous discovery
- Automated remediation
- Customizable
Cons:
- Not ideal for beginners.
Our Review: Dynatrace carves a name for itself among the best, largely because of its AI. Thanks to its AI, Davis, you can expect infrastructure monitoring that is intelligent and automated across hybrid and cloud environments.
Price: Infrastructure monitoring will cost you $0.04 per hour for any size host. The full stack monitoring plan will cost you $0.08 per hour for an 8GB host.
Website: https://www.dynatrace.com/
#11) AppDynamics
Best for optimized app environment.
AppDynamics by Cisco does a great job of monitoring the most complex of IT infrastructures. The software immediately grants you complete visibility across hybrid and cloud-native environments. The software cuts down downtime by connecting critical user and business experience outcomes and is also easy to scale.
The software can be scaled intelligently through hybrid infrastructure. Tasks are automatically ranked between legacy and new environments to find out what your business could benefit from the most. AppDynamics also excels at automation. All crucial aspects related to monitoring, like data collection and problem detection, are automated.
Features:
- Database Monitoring: AppDynamics does a good job of monitoring events occurring within your database. Events like system notifications and user actions are tracked. By assessing these events, the tool can detect potential issues.
- Threshold Alerts: It is very easy to create and customize threshold alerts. The tool tracks changes in your infrastructure’s performance in real-time and sends alerts to you automatically via SMS or email.
- Issue Isolation: Issues detected are easily isolated for effective resolution. Purpose-built observability tools quickly isolate performance issues within cloud environments. This is done for all containerized apps and Kubernetes workloads.
- Server Monitoring: The software is great at tracking the health and performance of servers. Issues are identified before they can cause any significant harm. You can count on the tool to monitor for errors like security breaches or corrupt files.
- Data Collection: Data collection in AppDynamics is significantly automated. AppDynamics further streamlines your monitoring by correlating cloud-native services to app codes, user experiences, and the impact on business metrics.
Pros:
- Automated data collection
- Strong support
- Quality documentation
Cons:
- Some users have complained about the UI being complicated.
Our Review: AppDynamics does what a good infrastructure monitoring tool is expected to do. It helps you visualize every component that’s active in your infrastructure across cloud and hybrid environments. While its UI leaves a lot to be desired, I still found its features backed by automation very impressive.
Price: Contact the AppDynamics team for a custom quote. A free trial and demo are available upon request.
Website: https://www.appdynamics.com/product/infrastructure-monitoring
#12) Nagios
Best for powerful monitoring engine.
Nagios XI is perhaps the most underrated of all infrastructure monitoring tools out there. Users who’ve had the privilege of using it, often hail it for its scalable and efficient monitoring capabilities. This efficiency is thanks to a powerful monitoring engine. Another stand-out aspect of this software is the attention paid to simplicity.
Nagios utilizes the Neptune UI, which makes navigating and using the tool very simple. Visualization in Nagios is also impressive. You get advanced graphs and charts that help you comprehensively view network issues so you can solve them before it is too late. Thanks to features like bulk host import and auto-discovery, managing your infrastructure is also a breeze with Nagios.
Features:
- Comprehensive Monitoring: Nagios facilitates seamless monitoring, thanks to its powerful monitoring engine. You can rely on the tool to extensively monitor all critical components, apps, and systems on your network.
- Centralized View: Nagios helps you gain a consolidated view of all monitoring data. You can respond to issues much more quickly with the help of capacity planning graphs. The visualization helps you be proactive when responding to errors and network problems.
- Extendable Architecture: Nagios stands out for its customizable architecture. Its layout and design can be tailored according to your needs. The tool facilitates several third-party integrations and offers multiple add-ons to aid you in the customization.
- Multi-tenant capabilities: Nagios XI’s Neptune-Themed UI makes the tool super user-friendly. The administration of tasks on the tool is considerably streamlined. You’ll also be able to seamlessly manage multiple user accounts.
- Easy Configuration: Configuring the tools is very simple. The software facilitates user-controlled configurations. This means you don’t need to be an expert in monitoring to configure the tool.
Pros:
- User-friendly interface
- Advanced user management
- Core 4 monitoring engine
Cons:
- A free plan is available, but support is only offered with the expensive premium plans.
Our Review: The makers of Nagios XI have poured a lot of effort into making the tool as simple as possible and that effort shows. This software is very easy to use while also being efficient and highly scalable in its infrastructure monitoring capabilities.
Price: Nagios offers a free plan. Its standard plan starts at $2,495 whereas its enterprise plan starts at $4,490.
Website: https://www.nagios.com/products/nagios-xi/
Best Practices in Infrastructure Monitoring
Now that you know about the tools that can help you with Infrastructure monitoring, you should also know some best practices to ensure great results. These are some practices I suggest for a smoother infrastructure monitoring endeavor.
#1) Only Collect Relevant Metrics: When you collect metrics indiscriminately, you can lose sight of critical insight. To make sure you aren’t missing it, only choose to collect relevant metrics. Understand what metrics to measure when it comes to virtual and physical machines. Check performance metrics regularly and review the collected data periodically.
#2) Rely on Automation: Infrastructure monitoring involves conducting hundreds of checks, sometimes at the same time. This can get exhausting manually. This is why automation is a must. Make sure you are using a tool that promises excellent automation. Use your tool’s automation to its fullest potential to gain deeper visibility into your infrastructure stack.
#3) Test Frequently: Simply launching your infrastructure monitoring tool won’t be enough. You’ll need to perform frequent tests to make sure everything is working fine. Test these tools regularly to ensure their functionality is top-notch. Frequent tests will keep the tool aligned with your company’s requirements.
Frequently Asked Questions
1. What is infrastructure monitoring?
Infrastructure monitoring is the process by which the health and performance of a company’s entire IT stack are measured. The process involves collecting, tracing, and assessing data collected from various monitored components across an enterprise’s IT infrastructure. Infrastructure monitoring must be continuous and consistent to ensure problems are detected and resolved proactively.
2. What does infrastructure monitoring include?
Infrastructure monitoring involves gaining an overview of an organization’s tech stack across multiple layers. The components that are usually monitored via such a process are as follows:
• Services
• Applications
• Networks
• Databases
• Servers
3. What are infrastructure management services?
Infrastructure management services refer to services that administer and manage data, technology, and information across multiple layers of a tech stack in a proactive manner.
4. What is the best monitoring tool?
In my experience and based on popular opinion online, I would claim that the following are some of the best monitoring tools out there:
• Paessler PRTG
• Middleware
• LogicMonitor
• Datadog
• New Relic
5. What are the benefits of infrastructure monitoring?
There are several benefits to infrastructure monitoring:
• Help businesses avoid hardware failure and performance issues.
• Gain deeper insight into the performance of your IT stack and take measures to enhance it in a bid to satisfy your customers.
• Address network or infrastructure issues in a timely fashion to avoid costly expenses on maintenance or replacement later.
• Help businesses thwart a variety of cybersecurity threats and comply with necessary regulations.
Conclusion
In light of rising IT-related issues and cyber threats, infrastructure monitoring solutions can offer businesses some much-needed sense of relief. These tools will ensure that the health and performance of components across your IT infrastructure stack is always top-notch.
The best infrastructure monitoring software will protect your business from issues like sudden downtime and performance degradation by detecting anomalies proactively.
As far as my preferences go, Paessler PRTG appeals to me the most. This is also a tool I would recommend to IT teams and businesses of all types who wish to gain total control and visibility over their IT stack.
Research Process
- I spent 22 hours researching and writing this article so you can have summarized and insightful information on which infrastructure monitoring tool will serve you best.
- Total Infrastructure Monitoring solutions researched: 21
- Total Infrastructure Monitoring services shortlisted: 11
Was this helpful?
Recommended Reading
-

Overview of Server Monitoring Tools: In today’s busy world, any business requires strong infrastructure, well-established network connections, powerful servers to handle loads of users or transactions, etc., to succeed in their business. Let's imagine that your business is running smoothly but suddenly one server, a service, or an application gets…
-

List and Comparison of the Top Website and Application Performance Monitoring APM Tools: In this era of Information Technology, Application Performance Management (APM) monitors the performance of software applications. APM ensures it provides services to the customer up to the level defined and identifies the problems related to the application…
-
Here we will compare and explore the top Synthetic Monitoring Tools and Services to guide you to select the best Synthetic Monitoring Tool for your business needs: Synthetic Monitoring tools or services are the solutions offered for verifying the performance, availability, reachability, and reliability of a website or application at…
-

Review of the Best Website Monitoring Tools and Services: When I open a website, I want it to run fast that too without any breaks. If what I expect is not available or if it has uptime with poor quality then I instantly switch to another website. And end up finishing…
-
Review, compare and select the best Network Bandwidth Monitoring Software from the list to prevent any major network collapse in the future: You will experience a slow network connection, be it Internet or Intranet, and one of the main reasons for network delays is high bandwidth usage. Slow or bottlenecks…
-
Application Performance Monitoring in DevOps: What is it, how to perform it, and top tools for automated Application Performance Monitoring We came to know more about Release Management in DevOps from our last tutorial. Another key aspect of DevOps is carrying out the Performance monitoring of the application in the…
-
A Comprehensive List of the Best Paid and Free Network Monitoring Tools and Software in 2026: Network Monitoring is the process of monitoring network components like routers, switches, firewalls, servers, etc. Network Monitoring Tool is an application that gathers useful information from different parts of the network. It will help…
-
List of System Monitoring Software with Features, Comparison & Pricing. Select the Best System Monitoring Tool For your Business Based on Your Requirements: As an organization grows, the workforce, resources, systems, services, and infrastructure also tend to grow considerably. The term 'Organization' covers all the computing resources, services, and infrastructure…