


In this Guide, we have Tested & Compared the Top CPU Temperature Monitor Tools, featuring Features and Price Comparison to help you pick the Best CPU Temperature Monitor Software according to your Needs.
Choosing the right CPU temp monitor may be challenging as every tool offers accurate and real-time hardware information.
We have tested and analyzed 11 best CPU temperature monitor tools, including comparison of sensors detection, usability, system load, alerts, hardware support, and overall efficiency.
No matter if you are looking for a CPU temperature monitor or full-featured hardware monitor software, our in-depth comparison will help you find the best fit for your PC.
Which CPU Temperature Monitor Is Best?
HWiNFO is the best CPU temperature monitor for Windows PC in general since it provides detailed information about CPU temperatures, CPU load, clocks, power consumption, fans speeds, GPU temperatures, storage health, logging, and thermal throttling warnings. 2026 comparisons of CPU temperature monitors prove HWiNFO as the best choice for advanced monitoring and troubleshooting
Best CPU Temperature Monitors at a Glance

The best CPU temperature monitor depends on whether you prioritize raw technical detail, gaming performance, lightweight usage, or full PC management.
| Best For | CPU Temperature Monitor | Why |
| Best overall | HWiNFO | Deep sensor coverage, logging, alerts, and troubleshooting |
| Best for simple monitoring | HWMonitor | Easy-to-read CPU, GPU, fan, voltage, and storage readings |
| Best lightweight CPU monitor | Core Temp | Focuses on per-core CPU temperatures with minimal overhead |
| Best free/open-source option | Libre Hardware Monitor | Open-source monitoring with broad hardware support |
| Best for gaming | MSI Afterburner | Displays CPU/GPU temperatures and other metrics through an in-game overlay |
| Best for AMD Ryzen | Ryzen Master | AMD’s own utility for Ryzen temperature, telemetry, and tuning |
| Best for Intel | Intel XTU | Intel’s utility for supported processors, with monitoring and tuning features |
| Best for advanced diagnostics | AIDA64 Extreme | Detailed monitoring, logging, diagnostics, and stress-testing features |
HWMonitor or Core Temp should be sufficient in case you just want to see if the CPU is overheating. In case of troubleshooting overheating issues, thermal throttling issues, unstable operation, and other issues, HWiNFO should be chosen because it provides much more data. The current 2026 guides recommend HWiNFO for extensive monitoring, HWMonitor for quick checking of all system parameters, and Core Temp for easy monitoring of the CPU only.
The fact is, occasional spikes around 100 °C are not harmful, but running at high temperatures for extended periods can have a negative impact on the CPU’s performance and can reduce the lifespan of the CPU and surrounding components. To ensure long-term stability, it is recommended that CPU temperatures remain well below the maximum.
In addition, you should ensure that your current cooling solution is sufficient. If your PC is still experiencing overheating issues, you may want to consider upgrading your cooling solution or even a newprocessor.
Who Needs a CPU Temperature Monitor?
CPU temperature tracking is not only for tech-savvy individuals, but it is a must for anyone who uses their computer for more than basic operations. Here’s who should definitely track CPU temperatures.
Today’s games are very CPU and GPU-intensive, which can lead to temperature surges. Tracking CPU temperatures can prevent overheating, throttling, and sudden shutdowns during gaming sessions.
Further Reading => Quick Guide to Overclock GPU Safely
- Overclockers: If you are overclocking your CPU to enhance its performance, then monitoring the CPU temperature is a must because Overclocking requires more power and hence more heat.
- Video Editors and Creators: Video editing software, 3D modeling, and graphic design software can be CPU-intensive, leading to an increase in CPU heat levels.
- Developers and IT Professionals: Running virtual machines, compiling code, and testing environments can be processor-intensive.
- Crypto Miners and Data Analysts: If Heavy computations are done for an extended period of time, then monitoring CPU temperature becomes essential.
- Laptop Users: Laptops have smaller cooling systems. Monitoring temperature can help detect if the laptop is overheating because of dust buildup, airflow, or old thermal paste.
What Causes High CPU Temperature?
The following are a few factors that can cause your CPU temperature to rise:
- High CPU Usage: Engaging resource-intensive applications, such as games, video editing software, and rendering software, etc., causes the CPU to work harder, resulting in more heat.
- Poor Airflow Inside the Case: Clogged vents, messy cables, or poor case airflow can cause hot air to get trapped inside the case, resulting in high CPU temperatures.
- Dust Build-Up: Dust buildup on fans, heatsinks, and air filters can cause reduced airflow and ineffective cooling.
- Slow Cooling Fans: If the CPU or case fans are damaged, improperly set, or running at a slower speed, the CPU heat will not be able to dissipate effectively.
- Dried Thermal Paste: Thermal paste helps to transfer CPU heat to the heatsink. If the thermal paste dries up or is applied improperly, the CPU heat will not transfer effectively.
- Overclocking: Overclocking the CPU clock speed to enhance the performance of the computer can also result in a substantial amount of heat being produced.
- Malware or Background Processes: Background processes or malware can consume the CPU resources without the user’s knowledge, resulting in an increase in the CPU temperature.
What is Normal CPU Temperature
Normal CPU temperature varies depending on several factors including workload, room temperature, cooler efficiency, and the CPU design—therefore, there is no general safe temperature that can be used under all circumstances.

[image source]
Also Read =>> Basics Of Microprocessor – How It Works
Normal CPU Temperature Ranges
| Workload State | Normal Range (°C) | Expected Behavior |
| Idle State | 30°C – 45°C | System is on desktop with minimal background tasks active. |
| Everyday Use | 40°C – 65°C | Web browsing, streaming 4K media, and light office applications. |
| Gaming & Moderate Load | 65°C – 85°C | High GPU/CPU utilization during gaming or light rendering. |
| Heavy Heavy Workloads | 80°C – 95°C | All-core stress tests, 3D rendering (Cinebench, Blender), or video encoding. |
CPU-Specific Temperature Thresholds (T_j “Max” ):
Intel Core CPUs: The current generation of Intel processors has a maximum T_j “Max” between 100°C and 105°C.
AMD Ryzen CPUs: The AMD Ryzen processor family has a maximum threshold range of 89°C to 95°C depending on the specific generation (Ryzen 3D V-Cache being an exception).
How to Read CPU Temperature Monitor Results
In order to determine the true health of the system, consider the temperature in context of usage percentage, clock speed and how long the process runs:
- Temperature vs. Usage Percentage: If temperatures are high, but CPU usage is minimal, you have a serious problem with either mounting of the cooler or thermal paste. In case CPU shows 85°C at 100% load, there is no problem.
- Thermal Throttling and Clock Speed: At a certain temperature, which is the thermal limit (T_j “Max”) , the CPU will reduce its clock speed and voltage in order to cool down. It happens due to the fact that your cooling solution is unable to dissipate heat quickly enough.
- Difference between Sustained Load and Spike: Modern CPUs use auto boost functionality to operate at high voltages just for some periods of time. Transient spikes (for example, rising temperatures of 45°C to 70°C during just one second when you open some application) are totally normal. Just pay attention to the sustained temperature under the steady workload.
CPU Package vs. Core Temperature vs. Tctl/Tdie
Most of the monitoring solutions show the following temperature results, which may confuse you:
- CPU Core Temperature: This is the actual reading of the sensors inside a processing core (Core 0, Core 1). Core temperature changes all the time depending on individual threads operation.
- CPU Package Temperature: This is the overall temperature of the CPU package. On Intel platform, this is the highest individual core temperature inside the die for the particular period.
- Tctl / Tdie (Ryzen):
- Tdie: The actual real-time temperature of the CPU silicon die.
- Tctl (Control Temperature): A software offset value added by AMD in order to make sure fans’ speed would be consistent with different coolers. Modern monitoring software shows Tctl/Tdie as a single sensor, showing maximum node temperature.
Further reading =>> How to update BIOS
Why Should You Monitor CPU Temperature?
The following are a few reasons why you should monitor your CPU temperatures regularly.
- Overheating: System overheating can result in instability, crashes, or shutdowns. Temperature monitoring allows you to catch overheating issues before they cause significant damage to your hardware.
- Peak Performance of the PC: When a CPU overheats, it triggers thermal throttling, which slows down the CPU clock speed to cool down. Temperature monitoring ensures that your PC stays within optimal temperatures.
- Hardware Life: Excessive heating can damage internal system components, such as the CPU, GPU, motherboard, and VRMs. Monitoring temperatures helps you maintain healthy hardware.
- High-Performance Computing: Gamers, video editors, programmers, and overclockers use temperature monitoring to handle heavy computing tasks without risking damage to their hardware.
- Saves Money: Computer hardware is quite pricey. Temperature monitoring helps you maintain an efficient system that is less likely to require expensive repairs or replacements.
11 Best CPU Temp Monitor Software: Tested & Reviewed 2026
- Paessler PRTG
- Site24x7
- HWiNFO
- Core Temp
- Open Hardware Monitor
- HWMonitor
- NZXT CAM Software
- Real Temp
- SpeedFan
- AIDA64 Extreme
- Speccy
- ManageEngine OpManager
- SolarWinds CPU Load Monitor
Comparing the Top PC Temp Monitors
| Best for | Platform | Category | Free Trial | Price | |
|---|---|---|---|---|---|
Paessler PRTG | Real-Time CPU Temp Monitoring | Android, iOS, macOS, Windows, Linux | Network Monitoring | 30 Days | Starts at $179/month (Billed Annually) |
Site24x7 | Providing smart, user-friendly solutions to monitor your devices’ CPUs. | Android, iOS, Windows, and Linux | Network Monitoring Solution | 30 Days | Starts at $9 per month |
HWMonitor  | Real-time monitoring of temperature. | Windows & Android | Hardware Monitoring Program | HWMonitor Pro can be tried for 30 days. | HWMonitor is free. HWMonitor Pro: Starts at $22.48. |
Open Hardware Monitor | Monitor temperature, voltage, and fan speed for free. | Microsoft Windows XP/Vista/7/8/8.1/10/ & x86 based Linux OS without installation | Hardware Monitoring Software | — | Free & Open source |
HWiNFO | Overview & detailed information on hardware components. | Windows & DOS | Hardware analysis, Monitoring, & Reporting software. | — | Free |
CoreTemp | Free tool to record and display temperature. | Windows | Processor temperature & other vital information monitoring program. | — | Available for free. Get a quote for commercial licenses. |
#1) Paessler PRTG
Best for Real-Time CPU Temp Monitoring.
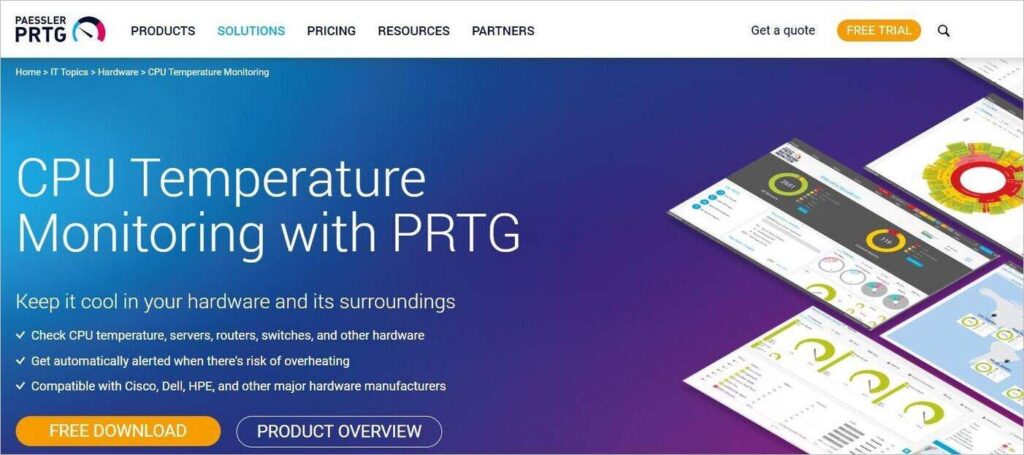
Paessler takes a more comprehensive approach to CPU temp monitoring, and that’s why it is placed so high on our list. You can rely on this platform for 24/7 tracking of CPU temperatures, load, and performance in real-time. The platform is effective in this because it leverages a variety of sensor types.
Paessler employs more than 250 preconfigured sensor types to keep tabs on your computer’s CPU temperature as well as other environmental values. To make things even simpler, the platform offers you data on CPU temperature and performance in a visualized form through a customizable, central dashboard.
Features:
- Uses more than 250 native sensor types to monitor on-premise, cloud, and hybrid environments.
- Identify issues comprehensively via visualized data in the form of graphs and a customizable dashboard.
- Get an alert automatically via SMS or email whenever a device is at risk of breaching thresholds.
- Compatible with CISCO, Dell, and other major hardware infrastructure.
Verdict: Paessler is exceptional at monitoring not just your CPU temperature but also keeping an unwavering eye on servers, routers, switches, and other hardware devices in real-time. The platform is widely compatible with major hardware manufacturers. As such, you can count on it to track every single device on your network.
Price: Paessler PRTG offers the following subscription plans:
- PRTG 500: $179/month
- PRTG 1000: $325/month
- PRTG 2500: $675/month
- PRTG 5000: $1183/month
- PRTG 10000: $1492/month
All plans are billed annually. A custom plan is also available upon request. You can also get a 30-day free trial or opt for a free demo.
#2) Site24x7
Best for providing smart, user-friendly solutions to monitor your devices’ CPUs.
To ensure smooth and efficient operation of your network devices it is necessary to monitor the CPU temperature. It generally comes with network monitoring tools. Site24x7 provides the CPU temperature monitoring services with integration to its network monitoring tools.
Site24x7 provides real-time temperature tracking, customisable alerts, detailed reporting, support from multiple vendors, multi-system compatibility, a user-friendly interface and network optimization all in a single platform to ensure the CPU stays healthy and performs well.
Features:
- Real-time temperature tracking to keep your informed.
- Generates instant alerts when the temperature crosswa the threshold limit.
- Provides comprehensive reports on temperature trends.
- Provides user-friendly and intuitive dashboards.
- Facilitates network optimization by identifying unnecessary energy consumption areas.
Verdict: Site24x7 is highly recommended for monitoring CPU temperature as it comes with a network monitoring solution and easily keeps a track of the CPU’s temperature in real-time and avoids system instability, reduced performance, or even permanent damage of the device that can occur if the CPU temperature is not properly monitored.
Price:
- Pricing plans are as:
- Website monitoring- Starts with $9 per month.
- Infrastructure- Starts with $9 per month.
- APM- $35 per month
- All-in-one- Starts with $35 per month.
- MSP- Starts with $45 per month.
- A 30-day free trial is available.
#3) ManageEngine OpManager
Best for network monitoring.

ManageEngine OpManager can monitor routers, switches, firewalls, servers, and VMs for faults and performance. Its physical and virtual server monitoring feature can monitor the CPU, memory, and disk utilization of Windows and Linux servers. It has the functionality of a multi-vendor hardware performance monitor.q
Features:
- ManageEngine OpManager provides graphs, alerts, and reports on the performance of your server and network hardware.
- With the help of OpManager, you can automate the remote troubleshooting tasks if a hardware error is detected.
- It can monitor hardware like servers, routers, firewalls, storage devices, etc., and will provide real-time information on their status and availability.
- You will get insights on temperature, fan speed, power supply, processor clock speed, etc.
Verdict: ManageEngine OpManager is a network monitoring software. It is easy to use and an affordable solution. It can perform physical and virtual server monitoring to monitor CPU, memory, and disk utilization of Windows and Linux servers.
Price: ManageEngine OpManager is available in three editions, Standard Edition ($245 for 10 devices), Professional Edition ($345 for 10 devices), and Enterprise Edition ($11545 for 250 devices).
Read our ManageEngine OpManager Detailed Review
#4) HWMonitor
Best for real-time monitoring of temperature.

HWMonitor is a tool for monitoring voltages, temperatures, and fan speed. The most common sensor chips, Winbond ICs, etc. are supported by the program. HWMonitor can read CPUs on-die core thermal sensors, hard drive temperatures, and video card GPU temperature. It reads the hard drive temperatures through S.M.A.R.T.
HWMonitor Pro provides additional features to HWMonitor. Also, it has an improved interface.
Features:
- HWMonitor Pro provides the features of remote monitoring. This will help you to watch the sensors of one or several distant PCs or Android devices through a simple TCP/IP connection.
- It has added a graph generator. You can save monitoring data and generate logging graphs. You can create these graphs as bitmap files.
- It supports Interface customization like editable labels, adding a sensor in the System Tray, and choosing a display mode by sensor type.
Verdict: This hardware monitoring program can read the PC’s main health sensors i.e. voltages, temperatures, and fan speed.
Price: HWMonitor is available for free. HWMonitor Pro is available in two editions, Standard ($22.48) and Extended ($39.40). It can be tested for 30 days.
#5) Open Hardware Monitor
Best for a free tool to monitor temperature, voltage, and fan speed.

Open Hardware Monitor is free software that supports Windows and Linux systems. It can be run on the Windows System with the .NET Framework version 2.0 and above and on the Linux systems that have Mono with WinForms. It will be easier to install, just unzip the archive and run the .exe file. The source code of the application is hosted on GitHub.
Further Reading => How to Check PC Specs on Windows
Features:
- Open Hardware Monitor can monitor temperature sensors, fan speeds, voltages, load & clock speeds of a computer.
- Most of today’s hardware monitoring chips are supported by Open Hardware Monitor.
- It reads the core temperature sensors of Intel & AMD processors to monitor the CPU temperature.
- It can display the temperatures of the SMART hard drive.
Verdict: Without installation, Open Hardware Monitor can run on 32-bit and 64-bit Microsoft Windows XP/Vista/7/8/8.1/10 & x86 based Linux OS without installation. You can download and use the application but it is in the Beta status.
Price: Free and open source.
#6) HWiNFO
Best for getting the overview as well as detailed information about the hardware components of your system.

HWiNFO is diagnostic software for comprehensive hardware analysis, monitoring, and reporting. You will get in-depth hardware information. It can perform real-time system health monitoring for system and hardware parameters like CPUs, GPUs, mainboards, drives, peripherals, etc. It is freeware and supports Windows and DOS.
Features:
- HWiNFO can detect overheating, overload, performance loss, or failure prediction.
- You will get a detailed hardware inventory report.
- Extensive reporting with full hardware hierarchy or quick summary overview can be exported into XML, CSV, and HTML.
- It will let you customize the alerts on any parameter that is monitored with user-defined actions.
Verdict: HWiNFO will help you with the checking of various hardware-related parameters. It provides exhaustive information about hardware components. It can be used in high radiation fields to monitor computer systems.
Price: Free
#7) Core Temp
Best free tool to record and display temperature.

Core Temp is a simple, compact, and powerful tool that can monitor processor temperature and other important information. It supports Windows OS and Intel, AMD, & VIA x86-based processors.
All the major processor manufacturers have included Digital Thermal Sensors in their products which gives more accurate and higher resolution temperature information. Temperature readings will be correct, as there will be a direct collection of data from Digital Thermal Sensors.
Features:
- Core Temp will let you know the temperature of each core of every processor in the system.
- Temperature fluctuations can be monitored in real time with varying workloads.
- It provides a mobile app for Android and Windows phones so that you can monitor your systems while you are out of the office or at home.
Verdict: The tool is motherboard agnostic. It is highly customizable, expandable, and easy to use. It can record and display temperature-related statistics. It will not take up much space on your hard drive.
Price: CoreTemp is available for free. You can get a quote for CoreTemp’s commercial licenses.
#8) NZXT CAM Software
Best for tracking every aspect of your computer.

NZXT CAM is free software for PC monitoring. This fast and efficient solution will let you control every aspect of the computer. It will give you detailed information about your computer from the processor load to bandwidth consumption.
Features:
- NZXT CAM will provide information on applications that are making use of every part of the machine.
- It can perform In-Game monitoring for current FPS, CPU/GPU temperatures, time played, battery level, CPU/GPU load, etc.
Suggested Read => Easy Methods to check FPS on PC
Verdict: NZXT Cam is a complete PC monitoring solution. It is easy to use. CAM-supported NZXT RGB products are AER Fan, Lighting Strip, Cable Comb, etc.
Price: NZXT CAM software is available for free.
Further Reading => Simple Steps on how to check your GPU Temp
#9) Real Temp
Best for all Intel Processors and provides good customization features.

Real Temp is a tool for CPU temperature monitoring. It is designed for all Intel Single Core, Dual Core, QuadCore, and Core i7 processors. There are Digital Thermal Sensors (DTS) on every core of these processors. These sensors will report temperature data relative to TJMax. This program stands on the temperature data gathered using a Fuke 62 IR Thermometer.
Features:
- Real Temp can read temperature information from all Intel Core-based processors.
- It can individually calibrate Real Temp for each core of your CPU.
- Your DTS sensors will be checked by test sensors for the signs of problems.
- It will keep track of minimum and maximum temperatures along with full logging features.
- It provides a high-temperature alarm and shutdown feature based on the CPU or NVIDIA GPU temperature.
Verdict: Real Temp doesn’t support Pentium 4 processors. It doesn’t require any installation. It supports Windows OS (32 & 64 bit). No need to modify the registry.
Price: Free
#11) SpeedFan
Best for power users.

Speed Fan can monitor voltages, fan speeds, and temperatures. By accessing the S.M.A.R.T. info it can provide the hard disk temperatures. SCSI disks are supported by SpeedFan. It supports Windows OS. Windows 64-bit is also supported by SpeedFan. It will let you configure which fan every temperature should rely on.
Features:
- Speed Fan changes the fan speed according to digital temperature sensors.
- It can handle almost any number of hardware monitor chips, hard disks, temperature readings, voltage readings, fan speed readings, PWMs, and South Bridges.
- A lot of new hardware is now supported by SpeedFan.
Verdict: SpeedFan is a useful tool for power users and is available for free.
Price: Speed Fan is available for free.
#12) AIDA64 Extreme
Best for stress testing of main components in any combination.

AIDA64 Extreme is a system information tool that will give you detailed information about hardware. It provides the benchmarks to measure the performance of the computer. It contains a hardware detection engine. It will give you insights into installed software and provide diagnostic functions.
AIDA64 Extreme supports overclocking. It will monitor the sensors in real-time. It supports Windows OS (32 bit/64 bit) and Windows Server 2016.
Features:
- AIDA64 Extreme will provide accurate voltage, temperature, and fan speed readings.
- A couple of benchmarks are provided by the tool to measure the performance of individual hardware and the whole system.
- It supports external displays that will help you view vital system data on a variety of LCD/VFD devices.
- AIDA64 Extreme comes with various features, like stress testing, accuracy, sensor panel, software audit, etc.
Verdict: AIDA64 Extreme is an industry-leading system information tool and popular among PC enthusiasts. The tool will help you with detecting and preventing hardware issues.
Price: AIDA64 Extreme is available for $29.96. A free trial is available for the product.
#13) SolarWinds CPU Load Monitor
Best for monitoring and graphing the load on multiple Cisco routers concurrently.

SolarWinds CPU Load Monitor comes with an Engineer’s toolset. Business networks are exposed to a large number of viruses and that can cause increased traffic load and CPU load on the routers. With the help of this tool, the load on multiple Cisco routers can be monitored and graphed concurrently. This will help you to stay ahead of problems.
Features:
- SolarWinds CPU Load Monitor will let you set the warning and alarm thresholds independently for each device.
- It can monitor and graph the load on multiple Cisco routers concurrently.
- It supports IPv6 and SNMP v3.
- The yellow load bar will represent that the load has reached the user-defined threshold for warning and the red bar will represent a critical level.
- Engineer’s Toolset will give you access to more than 60 network management tools.
Verdict: SolarWinds Engineer’s toolset is an all-in-one solution for managing the network. Just for monitoring a CPU temperature, it is an expensive tool but will be an efficient option for troubleshooting a network.
Price: SolarWinds CPU Load Monitor is a part of the Engineer’s Toolset. Its fully functional free trial is available for 14 days. The price of the tool starts at $1495.
Best CPU Temperature Monitors for Gaming
The tools needed to monitor temperatures of your CPU when gaming should not only have minimal effect on your computer’s performance but should also be able to provide real-time information about the temperature without requiring you to switch from your game.
• MSI Afterburner (with RTSS): Best for PC gaming overall. It can enable you to see real-time per-core temperatures, CPU package metrics, and frametime graphs right on top of your gaming window.
• NZXT CAM: Good choice for those who like to have an interface that is easy to use and does not need any configuration. This tool has an overlay with vital metrics of your CPU and GPU.
• FPS Monitor: Overlay software for gamers that has many options to customize your thermal graphs and other system metrics in real time.
• AIDA64 Extreme: Designed for hardware enthusiasts and multi-screen monitors. It is capable of outputting all the necessary diagnostics information to your secondary LCDs or telemetry widgets.
How to Check CPU Temperature on Windows 11/10
Neither Windows 11 nor Windows 10 comes with a native desktop CPU temperature monitor within the Task Manager and System Settings.
Method 1 – HWiNFO Checker (More Detailed and Precise)
- Step 1: Download and Run HWiNFO
- First, download the free version of HWiNFO here. Open the application and enable the Sensors-only option before clicking the Start button.
- Step 2: Locate the CPU Thermal Sensors
- Under the CPU category (your processor type, for example, Intel Core i7 or AMD Ryzen) find all your thermal sensors.
- Step 3: See the Package and Core Temperatures. Search for either CPU Package (overall temperature) or CPU Tctl/Tdie (AMD Ryzen only) to see package temperature. In addition, you can view your core temperatures as well.
Method 2 – HWMonitor (Lightweight and Quick)
- Step 1: Download HWMonitor
- First, download CPUID HWMonitor (free).
- Step 2: Expand Your CPU Tree View
- Your processor model will be listed in the main tree view under your hardware. Find it and click + to expand the list.
- Step 3: Check Current, Min, and Max Readings
- Under the Temperatures drop-down you will see current values and max/min temperatures.
How to Lower CPU Temperature
There are many different hardware and software tweaks that can be used to cool down a CPU in case you notice it works with elevated temperatures, especially close to its maximum threshold (T_j “Max”).
Step-by-Step Cooling Solutions
- Remove Dust and Increase Airflow through Case: The dust accumulated on heatsink, radiator and fan blades blocks heat transfer. Use compressed air for cleaning, make sure there is a dust filter on the fan intakes and airflow in your computer case is balanced or positive.
- Adjust Fan Curves: Optimize the CPU fan and case fan curves (intake / exhaust) in your motherboard BIOS or software, such as Fan Control. Set fans to increase RPM preemptively starting from 65°C to be able to cope with heavy load.
- Restart and Reapply Thermal Paste: The thermal paste applied on the cooler becomes dry and loses performance after a while. You can remove the old paste using >90% isopropyl alcohol and then you can apply a small drop of new paste and secure the cooler with even mounting pressure.
- Minimize Background CPU Consumption: Any unnecessary process running in background imposes some stress on the CPU. Task Manager (Windows) and Activity Monitor (macOS) will help you find the processes consuming background CPU cycles.
- Overclocking: Overclocking (increasing core multipliers or applying additional voltages manually) directly affects the heat generation of a CPU. Going back to default settings (or activating Intel/AMD default power limits) decreases heat dissipation drastically.
- Undervolting: Lowering the CPU core voltage offset decreases heat generation without affecting the clock speed. You can lower CPU temperature up to 5°C–15°C during load with the help of AMD Curve Optimizer or Intel XTU.
- Replace the Cooler: If you notice high temperatures even on the properly mounted cooler, then your CPU’s TDP exceeds the thermal capacity of the cooler. Replacement of the standard cooler to the dual tower air cooler.
FAQs
1. What is a Critical CPU temperature?
The CPU temperature that is too high can be measured when it stays above 90°C to 95°C (the exact value depends on the model of a CPU). The CPU automatically reduces performance or shuts down at 100°C to 105°C because it protects itself from physical destruction, however, the constant work near these values significantly decreases the life of components.
2. Why is my CPU temperature spiking up and down suddenly?
The rapid increase of 10°C to 20°C in the span of seconds is a completely normal phenomenon when it comes to modern Intel and AMD CPUs. Modern CPUs have aggressive auto-boost technologies that allow them to rapidly increase the voltage and frequency for short periods of time (e.g., when an app or a browser tab is being launched)
3. Can high CPU temperatures cause lag or FPS drops while gaming?
Yes, it will. When the temperature of a CPU is higher than its thermal limit (T_j “Max” ), the CPU automatically triggers thermal throttling – a process which includes reducing the frequency and operating voltage of its cores in order to cool itself down. That leads to significant decreases in FPS and input lag.
4. Is 70°C safe for a CPU while gaming?
Yes, it is an ideal, absolutely safe temperature for the CPU under the heavy gaming workload.
5. Does high CPU temperature mean my cooler is broken?
No, not really. The high temperature may be the result of wrong fan curves, excessive load from the applications running in the background, dust inside the case, hot environment of the room, or dried out thermal paste. However, in case of sudden CPU temperature reaching 95°C+ when the computer is just working on the desktop, there are some serious problems with your system.
Conclusion
To avoid the thermal damage of the motherboard and other devices CPU temperature should be monitored. It will help you to get continuous uptime and maintain peak performance. We have chosen various kinds of tools that can help you with CPU temperature monitoring.
SolarWinds CPU Load Monitor, HWMonitor, Open Hardware Monitor, HWiNFO, and Core Temp are our top recommended CPU Temp Monitors.
SolarWinds CPU Load Monitor, HWMonitor, Speccy, ManageEngine OpManager, and AIDA64 Extreme are commercial tools. Out of these commercial tools, HWMonitor and Speccy offer a free plan. Open Hardware Monitor, HWiNFO, Core Temp, NZXT CAM, and Speed Fan are completely free tools.
We hope this article will help you with the selection of the right CPU Temperature Monitor as per your requirements.
Research Process:
- Time taken to research and write this article: 26 Hours
- Total tools researched online: 20
- Top tools shortlisted for review: 11
Was this helpful?
Recommended Reading
-

Comprehensive Review & Comparison of Best Driver Updater Tools with Price, Features, and Ratings to Help You Select the Driver Update Software: Updating your system's device drivers is essential to ensure system stability. Similarly, it helps to fix issues and the performance of your PC. However, manual updates may take…
-
List of the Top Computer Stress Test Software: Best CPU, GPU, RAM, and PC Stress Test Software. Stress testing is a type of performance testing that validates the highest limit of your computer, device, program, or network with an extreme load. Stress testing will check the behavior of a system,…
-

This post is the second part of the Oracle Database Testing series. The first part 1 can be found here. Here, we will look at the systematic ways of testing Oracle Database for memory, space, and, CPU. In the first part, we have defined the term "database", the reasons for…
-

Review of the Best Website Monitoring Tools and Services: When I open a website, I want it to run fast that too without any breaks. If what I expect is not available or if it has uptime with poor quality then I instantly switch to another website. And end up finishing…
-
A Comprehensive List of the Best Paid and Free Network Monitoring Tools and Software in 2026: Network Monitoring is the process of monitoring network components like routers, switches, firewalls, servers, etc. Network Monitoring Tool is an application that gathers useful information from different parts of the network. It will help…
-
List of System Monitoring Software with Features, Comparison & Pricing. Select the Best System Monitoring Tool For your Business Based on Your Requirements: As an organization grows, the workforce, resources, systems, services, and infrastructure also tend to grow considerably. The term 'Organization' covers all the computing resources, services, and infrastructure…


