


Comprehensive review and comparison of Azure Monitoring Tools to help you monitor and detect issues in applications or infrastructure:
Azure Monitoring tool is an application for consolidated monitoring, application visibility, and advanced security.
These tools logically group Azure services from different Azure subscriptions and regions. They provide visibility for serverless applications. Azure Monitoring tools will help you to know the health of your apps.
=> In-Depth Azure Tutorials for Beginners
Table of Contents:
- Azure Monitoring Software: Top-Rated List
- List of Azure Monitoring Tools
- Comparison of Best Azure Monitors
- #1) NinjaOne (Best Overall)
- #2) Site24x7
- #3) ManageEngine M365 Manager Plus
- #4) ManageEngine Applications Manager
- #5) Application Insights
- #6) Azure Monitor
- #7) Service Bus Explorer
- #8) Cerebrata
- #9) CloudMonix
- #10) Datadog
- #11) Dynatrace
- #12) Log Analytics
- #13) New Relic
- #14) Turbo360
- #15) Better Stack
- #16) Nodinite
- #17) Splunk
- Conclusion
Azure Monitoring Software: Top-Rated List

Azure Monitoring tool performs end-to-end monitoring and detects issues in applications or infrastructure. It can manage Azure in virtual machines or containers. It can detect bottlenecks and collect data on a large variety of other tasks.
Recommended Reading => Azure Active Directory
The below graph will show you the statistics for the top countries using Azure Monitor:

Expert Advice: Azure Monitoring tools will help you to improve the efficiency of your operations and resolve issues through its services. While choosing these tools the first thing you should consider is the business use case. It is important to find out the type of monitoring tool needed for your Azure application.
Determine whether you just want to know the performance of the application or want to find out the errors in your application at the right time to rectify them.
Why use other tools for Azure Monitoring when the portal itself offers Azure Monitor?
Azure Monitor is a solution to monitor Azure entities. A consolidated report on the status of all the azure entities participating in the business application is required. It is a challenging task to correlate the reports on every entity. Azure Monitoring tools can provide this type of consolidated reporting.
It’s very alert rule is strongly tied to an entity. It allows a couple of metrics to configure for monitoring. Advanced tools can monitor multiple entities on an extensive list of metrics. It can monitor serverless applications based on various perspectives such as availability, reliability, performance, etc.
The below image will show you the difference between “What can be monitored?”:

Azure Monitoring tools like Serverless360 provide features like Azure service bus monitoring and management, Azure event hub monitoring and management, Azure event grid monitoring & management, Azure SQL database monitoring and management, Azure Functions Monitoring and management, and Azure Logic Apps monitoring & management capabilities, all in one platform.
They provide granular user access policy, azure governance, and audit capabilities. These tools offer a variety of monitors that will help you to monitor the status of a Relay, Dead Lettered Message count in the Service Bus Queue/Topic Subscription, etc.
Benefits of Azure Monitors
You will get on-demand computing, storage, and network resources to host, scale, and manage web applications and services through Microsoft Azure. It is a flexible and powerful cloud computing platform. This platform helps businesses focus on their goals and objectives.
To incorporate healthy functioning in the organization, it is important to understand the errors at the right time. These tools will help you to keep an eye on various components integrated into a business application.
Azure Monitoring solutions scan the complete Azure Infrastructure and provide performance reports. It provides the benefits of seamless monitoring, better infrastructure visibility, notifications, and automatic resolution. Azure Monitoring Solutions help Azure Developers, Testers, DevOps teams, and Support teams.
List of Azure Monitoring Tools
Here is a list of the most popular Azure Monitors:
- NinjaOne (Best Overall)
- Site24x7
- ManageEngine M365 Manager Plus
- ManageEngine Applications Manager
- Application Insights
- Azure Monitor
- Service Bus Explorer
- Cerebrata
- CloudMonix
- Datadog
- Dynatrace
- Log Analytics
- New Relic
- Turbo360
- Better Stack
- Nodinite
- Splunk
Comparison of Best Azure Monitors
| Tools | Our ratings | Best for | Businesses size | Free Trial | Price |
|---|---|---|---|---|---|
| NinjaOne | 4.5 Stars | Remote monitoring and management | Small to Large businesses | Available | Quote-based |
| Application Insights | 4.5 Stars | Monitoring live applications | Medium to large businesses. | — | Based on the volume of telemetry data and the no. of web tests. |
| ManageEngine M365 Manager Plus | 5 stars | Monitoring M365 Services 24/7 | Small to Large businesses | 30 days | Standard edition: Starts at $345/mon for 100 users/mailboxes, Professional edition: Starts at $595/mon for 100 users/mailboxes. |
| ManageEngine Applications Manager | 4.5 Stars | Monitoring the entire Azure Suite from a single dashboard. | Mid to large-sized enterprises | You can monitor up to 5 apps for free | Starts at $395/year. A free plan is also available. |
| Azure Monitor | 4.5 Stars | Providing full observability into your applications, infrastructure, and network. | Small to large businesses. | You can start for free | It starts at $219.52 per day for 100 GB per day. |
Service Bus Explorer | 4 Stars | Connecting to a Service Bus namespace and administer messaging entities. | — | Free | Free |
| Cerebrata | 4 Stars | Managing a multitude of Azure Services. | — | Available for 30 days. | Individual plan ($39 per user per month) Enterprise plan ($99 per user per month) |
Review of the tools:
#1) NinjaOne (Best Overall)
Best for: Remote monitoring and management.

NinjaOne automates the hardest parts of IT, delivering visibility, security, and control over all endpoints for more than 20,000 customers.
The NinjaOne automated endpoint management platform is proven to increase productivity, reduce security risk, and lower costs for IT teams and managed service providers. The company seamlessly integrates with a wide range of IT and security technologies. NinjaOne is obsessed with customer success and provides free and unlimited onboarding, training, and support.
NinjaOne is #1 on G2 in endpoint management, patch management, remote monitoring and management, and mobile device management.
Features:
- Monitor devices in real-time
- Alerts are sent automatically as soon as a network issue detected
- Automation of repetitive endpoint tasks.
- Automation of endpoint issue detection and resolution
- Automatically patch OS vulnerabilities
Verdict: NinjaOne offers a comprehensive suite of tools that seamlessly integrates with Microsoft Azure to get you total control over your network and endpoint devices. Known for its automation and real-time monitoring capabilities, NinjaOne is a significant monitoring tool for Azure.
Price: NinjaOne adheres to a pay-per-device model. Contact for a custom quote.
#2) Site24x7
Site24x7 provides the availability and performance of your Microsoft Azure infrastructure and applications running on the platform.

Features:
- More than 100 services are supported for monitoring including IaaS services, such as virtual machines (VMs) and Kubernetes, and PaaS services like App Service, Event Hubs, and SQL database.
- One-step authentication and auto-discovery of your entire Azure environment.
- An exclusive Azure VM extension is available in the Azure marketplace to provide more than 60 performance metrics for your Windows and Linux VMs.
- Best practices and recommendations for your Azure services to reduce costs, optimize performance, and close security gaps.
- Automatic fault resolution system across the cloud resources to reduce MTTR.
- Robust AI-based forecasting engine to preempt resource constraints and prevent potential issues.
- Centralize and manage logs from all cloud resources, VMs, and application services.
Further Reading => Top Azure Cost Monitoring Software
#3) ManageEngine M365 Manager Plus
Best for Monitoring M365 Services 24/7.
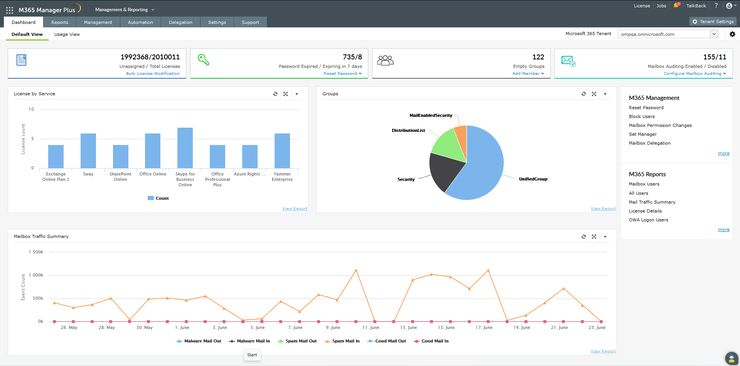
M365 Manager Plus is used for reporting, managing, monitoring, auditing, and creating alerts for critical activities. It helps manage users, mailboxes, password resets, license assignments, permission changes, and more in bulk with a simple CSV file.
With its user-friendly interface, you can easily administer Exchange Online, Azure Active Directory, Skype for Business, OneDrive for Business, Microsoft Teams, and other Microsoft 365 services from a single console.
You can monitor Microsoft 365 services around the clock, and receive instant email notifications about service outages. M365 Manager Plus eases compliance management with built-in compliance reports and offers advanced auditing and alerting features to keep your Microsoft 365 setup secure.
Features:
- Health and Performance Monitoring
- Microsoft 365 Help Desk Delegation
- Microsoft 365 automation
- Exchange Online and Azure Active Directory Management
Verdict: M365 Manager Plus is an extensive Microsoft 365 administration solution from ManageEngine that helps manage your Microsoft 365 environment with ease. Its flexible pricing and user-friendly interface earn it a well-deserved position on our list.
Price:
- A free trial and a free edition are available
- Standard edition: Starts at $345 per month for 100 users/mailboxes
- Professional edition: Starts at $595 per month for 100 users/mailboxes
#4) ManageEngine Applications Manager
Best for Monitoring the entire Azure Suite from a single dashboard.
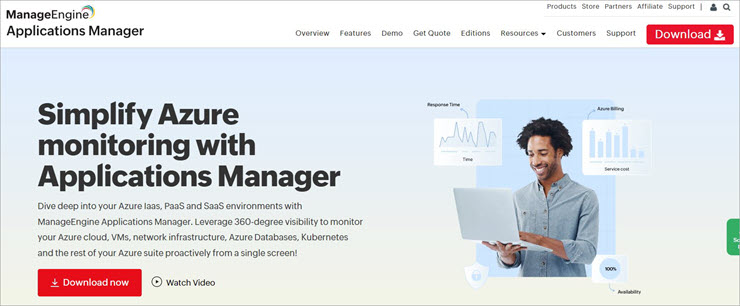
ManageEngine Applications Manager is the best choice for comprehensive, real-time monitoring of the entire Azure suite from a single dashboard. It provides a unified view of your application and infrastructure health, allowing you to collect, analyze, and act on metrics data.
ManageEngine Applications Manager delivers comprehensive agentless monitoring for Azure environments, ensuring optimal performance and availability of your cloud services. By collecting and analyzing real-time telemetry from Azure VMs, storage accounts, service buses, Kubernetes service containers, and SQL databases, Applications Manager empowers IT teams to proactively identify and resolve issues.
With deep visibility into application performance and a robust fault management system, Applications Manager offers actionable insights and automated remediation. Trusted by over 5,000 businesses worldwide, the tool is essential for IT Operations, DBAs, DevOps, and other IT roles to optimize cloud investments and deliver exceptional user experiences.
Features:
- Cohesive monitoring of Azure resources and its dependent apps from a single console.
- Customizable dashboards that help you aggregate and monitor Azure applications, performance, and infrastructure metrics in a single place.
- Configurable anomaly profiles and thresholds to prevent fault occurrence and unnecessary oversight.
- Automate corrective actions using web hooks to start external actions.
- Machine learning enabled analytics, which helps anticipate future resource utilization and growth.
Verdict: ManageEngine Applications Manager excels as a comprehensive, unified performance monitoring solution for complex IT environments. Its ability to monitor both on-premises and cloud infrastructure, including a deep focus on Azure, positions it as a strong contender for organizations seeking to optimize application performance and reduce operational costs.
Pricing: Applications Manager is free for 30 days. The price starts @ $945 for monitoring 25 application or server instances.
#5) Application Insights
Best for monitoring live applications.

Application Insights is a feature provided by the Azure Monitor. It will help monitor your live applications. Performance anomalies will be detected automatically. It can be integrated with Visual Studio App Center to monitor and analyze telemetry from mobile apps.
Features:
- Application Insights provides a powerful analytics tool to diagnose issues.
- It supports apps on a wide variety of platforms like .NET, Node.js, Java, etc. that are hosted on-premise, hybrid, or any public cloud.
- It can be integrated with your DevOps process.
- It has connection points for various development tools.
Verdict: Application Insights can be used to instrument the web service application as well as background components and the JavaScript in the web pages. It can be run anywhere and no need to host in Azure. It can be used by installing SDK or by enabling Application Insights through Application Insights Agent if supported.
Price: Application Insights will be priced based on the volume of the telemetry data sent by your applications and the number of web tests you have chosen to run. The price for the Azure monitor starts at $219.52 per day for 100 GB per day. Azure Monitor allows you to start for free.
#6) Azure Monitor
Best for providing full observability into your applications, infrastructure, and network.

There are some built-in tools in Azure for management and governance. You will be able to manage and secure your hybrid cloud resources with these tools. Azure Monitor is one of these tools. It is a platform to monitor your Linux & Windows VMs and their health and dependencies all on a single map. No need to log in to virtual machines to monitor and diagnose network issues
Features:
- A centralized, fully managed, and scalable data store that can store and analyze all your operational telemetry. It is optimized for performance and cost.
- It has an advanced analytic engine, interactive query language, and built-in machine-learning constructs.
- It can be integrated with popular DevOps, issue management, IT service management, and security information and event management tools.
- It provides support for popular languages such as .NET, Java, and Node.js.
Verdict: Azure Monitor will let you monitor the infrastructure including virtual machines, Azure Kubernetes Service, Azure Storage, and databases. It will help you to maximize the performance and availability of your applications. It will proactively identify problems.
Price: You can start for free with an Azure monitor. The price starts at $219.52 per day for 100 GB per day.
#7) Service Bus Explorer
Best for connecting to a Service Bus namespace and administering messaging entities.

Microsoft Azure Service is the service for delivering information. It will make communication easier. There are two types of messaging patterns supported by the Service Bus, Azure Relay, and Service Bus Messaging. The Service Bus Explorer is a tool to connect to a Service Bus namespace and administer messaging entities.
Features:
- The Service Bus Explorer contains advanced features like import/export functionality.
- It can test topics, queues, subscriptions, relay services, notification hubs, and events hubs.
Verdict: Service Bus Explorer is the management tool that is available for Azure Service Bus.
#8) Cerebrata
Best for managing a multitude of Azure Services.

Cerebrata is an Azure management tool that will let you manage a multitude of Azure Services such as Azure Subscriptions, Storage, Cosmos DB, Service Bus, etc. It supports cross-platform. The tool will let you explore Classic Cloud Services running in your Azure Subscriptions and you can even perform basic management operations on them.
It provides the facility to add resources to favorites. You can open these favorite resources in a read-only or read-write mode so that there will not be any accidental deletes or updates.
Features:
- It has features to manage databases, containers, stored procedures, triggers, user-defined functions, etc.
- It has a user interface or built-in console to manage databases and keys in your Redis Cache accounts.
- It will also let you perform basic management operations on the accounts.
- You will be able to manage blob storage, file storage, queue storage, and table storage in your accounts.
- In your Service Bus accounts, you can manage queues, topics, subscriptions, and messages.
Verdict: Cerebrata will let you add resources to favorites so that the resources can be accessed easily without navigating through the resource hierarchy. It will let you set permissions on resources. It provides a feature that will let you assign a friendly name to a resource. This makes the management of the application easier. It is a highly customizable platform. It is suitable for businesses of any size.
Price: Cerebrata has two professional plans – An individual plan ($39 per user per month) and an Enterprise plan ($99 per user per month).
#9) CloudMonix
Best for monitoring and automation.

CloudMonix is a cloud and on-premises resources monitoring tool. It will monitor for performance and availability. It will notify of production issues. It provides the features and functionalities to automate recovery procedures and auto-scale resources in real-time. Through its live dashboards, you will be able to visualize all your systems and resources in one place.
Features:
- CloudMonix provides deep and immediate insight into the stability of complex software systems. It has performance dashboards, status dashboards, alerts dashboards, etc.
- You can automate recovery procedures by scripting common responses to production issues.
- It can be integrated with 3rd party software that will help to increase operational efficiency.
- DevOps team can get system-wide visibility into resource utilization, application performance, and operational health.
Verdict: CloudMonix is a tool for MSPs, CSPs, and DevOps. It provides Automation, Easy Onboarding, and Multi-Customer Support. It has additional monitoring capabilities and self-healing automation and auto-scaling. It has advanced reporting features.
Price: A free trial is available. CloudMonix offers three pricing plans, Starter (Free), Professional ($15 per resource per month), and Ultimate ($20 per resource per month).
#10) Datadog
Best for monitoring and security.

Datadog offers various solutions for network monitoring, APM, log management, Serverless, Real-User Monitoring, etc. It offers the APM solution to monitor, troubleshoot, and optimize end-to-end application performance. It provides full-stack observability, service mapping, search & analytics, visualizations & alerts, and automatic instrumentation.
Features:
- Datadog APM provides features to collect, search, and analyze traces across fully distributed architectures.
- It can monitor containers, cloud instances, on-premise & hybrid architectures.
- It provides functionalities to isolate the services that interact with the application of interest for investigating the service disruptions.
- With Datadog, you can drill down on performance metrics by using any tag at infinite cardinality.
- It has features of advanced dashboarding & alerting and auto-instrumentation for distributed tracing.
Verdict: Datadog can provide full visibility into modern applications. You will be able to track app performance with auto-generated service overviews.
Price: Datadog offers various pricing plans for Infrastructure, Log Management, APM, Serverless, Security, and many more. APM price starts at $31 per host per month. The Serverless price starts at $5 per function per month.
#11) Dynatrace
Best for advanced observability for the entire Azure environment.

Dynatrace offers an Azure monitoring solution that will provide advanced observability for your entire Azure environment. With Dynatrace you will get visibility at a scale of hosts, VMs, containers and orchestration, network, devices, logs, events, etc. It provides AI-assisted problem detection with the root cause.
To provide a precise root cause, Dynatrace’s AI continuously analyzes billions of dependencies.
Dynatrace provides a platform with automated deployment that will give you full coverage across all applications and infrastructure in the Azure environment. It becomes a unique platform with functionalities like advanced observability, continuous automation, AI assistance, cross-team collaboration, and User experience & business analytics.
Features:
- Dynatrace provides the features of auto-discovery and continuous dependency mapping.
- It automates the monitoring of Azure Cloud Services such as App Service, Cosmos DB, AKS, and many more.
- It provides full-stack observability including metrics, logs, and traces.
Verdict: You will leverage event-driven continuous delivery and automated operations. The tool will help you to automate CI/CD that will speed up pipelines, improve code quality for productions, shorten innovation lifecycles, etc. It has functionalities of continuous automatic monitoring of DevOps tools.
Price: Dynatrace offers a free trial for 15 days. It has three pricing plans, Full-stack monitoring (starts at $69 per month), Infrastructure monitoring (starts at $21 per month), and Digital experience monitoring (starts at $11 per month). All these prices are for annual billing.
#12) Log Analytics
Best for collecting telemetry from Windows and Linux virtual machines.

Azure Log Analytics Agent is a tool to collect telemetry from Windows and Linux virtual machines in any cloud or on-premise machines. It supports Windows and Linux OS.
Features:
- You can use the Log Analytics Agent with virtual machines in Azure, other clouds, and on-premises.
- The data will be sent to Azure Monitor Logs.
- It is also suitable for the machines monitored by the System Center Operations Manager and sends the collected data to your Log Analytics workspace in Azure Monitor.
- Other services in the Azure monitor are also supported by Log Analytics Agents such as Azure Monitor for VMs, Azure Security Center, and Azure Automation.
Verdict: Log analytics is a tool to collect telemetry from Windows and Linux virtual machines in any cloud and on-premises machines.
Price: You will not have to pay any cost for the Log Analytics Agent but there can be charges for data ingested.
#13) New Relic
Best for a unified view of your software and systems.

New Relic is the platform for Application Performance Monitoring that will let you instantly understand application performance, dependencies, and bottlenecks. It can provide insights on page load times, error rates, slow transactions, and a list of servers running the app.
It has a custom dashboard. It has a secure data center that stores customers’ data in a Tier III, SSAE-16-certified data center. Full-Stack Observability will help you to troubleshoot, debug, and optimize performance across your entire stack.
Features:
- It provides features for database monitoring that will give you a detailed overview of database performance.
- It provides the features of Alert policies that will let you set thresholds for groups of applications.
- It provides features to create and receive customized reports.
- It provides reporting on everything from deployments & availability to performance.
- The tool helps DevOps teams to collaborate, share, and work together to solve problems.
- It provides the features of auto-instrumentations for the industry-leading eight programming languages.
Verdict: New Relic will provide a complete view of your applications and operating environment on a single screen regardless of the fact where your applications run. It provides in-depth transaction details.
Price: You can sign up for free. The Telemetry Data platform will cost you $0.25 per GB ingested beyond the free limit. There are three plans for full-stack observability, Standard ($99 per additional user/month), Pro, and Enterprise.
#14) Turbo360
Best for operations and support for Microsoft Azure serverless resources.

Turbo360 is the provider of Azure serverless monitoring and management services. It provides one platform to monitor all your serverless integration solutions. The solution offers advanced security on Composite Applications with Azure Active Directory integration, granular user access policy definition, governance, and audit.
It has built-in notifications with popular notification channels like Slack, PagerDuty, Microsoft Teams, etc. It offers a range of monitors suitable for product managers, DevOps teams, Architects, and quick detection of any failure. Turbo360 has threshold monitors that offer the features of Autocorrect on resource state and you will be able to restore business with no manual intervention.
Features:
- Monitoring Azure resources and alerting Azure resources cohesively.
- Group siloed Azure resources from different resource groups, subscriptions, and regions in a single dashboard-Composite Application feature.
- BAM to achieve end-to-end tracking of business transactions.
- Cloud Docs to interpret your cost and resource information on Microsoft Azure subscription into readable documentation.
- Azure Service map to visualize your entire application architecture and help track the issue.
- Azure Service bus Message processing capabilities.
Further Reading => Most Popular Azure Cost Management Tools
Verdict: Turbo360 is a monitor for serverless applications. With this tool, you will get a consolidated monitoring report on the status of all entities in an application. It can monitor multiple entities of different types in a single monitor. Entities will be monitored on multiple metrics by Serverless360.
Price: Turbo360 offers a free trial of 15 days. You can get a quote for the Enterprise plan.
#15) Better Stack
Best for Real-time monitoring of various Azure Resources.

Better Stack offers comprehensive cloud monitoring capabilities. The tool can help users gain deeper insight into their Azure infrastructure. It facilitates the real-time monitoring of various Azure resources such as virtual machines, storage accounts, databases, etc. The comprehensive monitoring helps in detecting bottlenecks and performance issues way ahead of time.
The tool also features a sleek and intuitive user interface… one of the best we’ve witnessed from a tool with such capabilities. You get a visual dashboard that provides you with a clear overview of key metrics. As such, you are in a better position to assess the health and performance of your Azure resources.
Features:
- Customizable Alerts and Notifications
- Pre-Built Visual Dashboard
- Automatically Detect Azure resources
- Incident Management
- Advanced Analytics and Reporting
Verdict: Better Stack is a comprehensive cloud management and monitoring solution that offers users the ability to monitor Azure resources in real time. It features an intuitive interface that promotes collaboration and proves ideal for experienced professionals and newcomers to Azure.
Price: Better Stack offers 3 pricing plans. They are as follows:
- Freelancer: $30/month
- Small Team: $100/month
- Business: $200/month
A forever-free plan is also available.
Check our Better Stack Detailed Review
Additional Tools
#16) Nodinite
Nodinite provides a single platform to monitor and manage your Azure-based integrations and track all messages.
It provides end-to-end logging and monitoring. It provides features for Azure Logic Apps, Azure Service Bus, Azure SQL Databases, Azure API Management, and Azure Functions. You can get a quote for pricing details.
#17) Splunk
Splunk is the platform for investigating, monitoring, analyzing, and acting on your data. It is a scalable and reliable data platform. It provides real-time visibility across your entire business.
It follows a unique investigative approach. It provides powerful analytics and automation on-premise as well as in the cloud. It has integrated AI and Machine Learning. A free trial is available for the tool.
Conclusion
Azure Monitoring tools provide consolidated monitoring and smart solutions. It performs business activity monitoring. Business applications will be better managed by the use of these solutions. Serverless360, Application Insights, Azure Monitor, and Service Bus Explorer are our top solutions for Azure Monitoring.
Overall, Serverless360 is the best tool to manage and monitor your Azure Serverless Components. If we compare Serverless360 with top solutions like Azure Monitor and Service Bus Explorer then Serverless360 offers more features like providing consolidated monitoring reports on the status of all entities in an application and preventing message loss. Serverless360 has a much broader scope than Service Bus Explorer.
Serverless 360 is the solution to manage and monitor the capabilities of Logic Apps, Function Apps, Event Grid, Storage Accounts, and many more.
Suggested reading =>> Serverless360 Review
We hope this article will guide you to select the right Azure Monitor for your needs.
Research Process:
- Time is taken to research and write this article: 28 Hours
- Total tools researched online: 22
- Top tools shortlisted for review: 13
Was this helpful?
Recommended Reading
-

Evaluate the top Cost Monitoring Software for Azure with features. Select the best Azure Cost Monitoring tools to analyze, manage, and monitor your overall costs across all Azure services: In the ever-evolving landscape of cloud computing, managing costs efficiently as an organization grows its footprint in Microsoft Azure is a…
-
Review of the top Azure Cost Management Tools with features to increase your Azure cloud investment. Pick the best Cost Management tool for Azure as per your needs: Dozens of Azure cost management tools are available today in the market. We have hand-picked the best ones, focusing on cost optimization…
-

Read this tutorial to understand how to monitor Azure Service Bus proactively to constantly track your services’ performance: Most of today’s enterprises rely on the cloud for developing their business applications. As the Azure footprint evolves, monitoring the resources becomes inevitable. It is mandatory to ensure the health and performance…
-

List and Comparison of the Top Website and Application Performance Monitoring APM Tools: In this era of Information Technology, Application Performance Management (APM) monitors the performance of software applications. APM ensures it provides services to the customer up to the level defined and identifies the problems related to the application…


