Discover the process of setting up JFrog Xray Cloud to Scan Repositories. See how to integrate JFrog Xray with Atlassian Jira Cloud to create tickets for any violation:
JFrog Xray is a component analysis tool that scans and analyzes the components of your software artifacts for security and compliance issues/vulnerabilities on open source and license compliance violations.
Xray provides visibility into issues by scanning binary components and their metadata and recursively going through the dependencies. Even a tiny binary component that might affect your application will be analyzed. It integrates with JFrog Artifactory. Therefore, we must identify these vulnerabilities before deploying artifacts to Production.
Table of Contents:
How to Set Up JFrog Xray & Integrate With Jira
In this article, we will look at how to Set Up JFrog Xray Cloud to Scan Repositories and integrate with Atlassian Jira Cloud to create tickets for each violation.
How Does X-Ray Scan Artifacts?
Here is a step-by-step procedure to perform the scan using Xray
- Xray global database: Xray populates vulnerability and license data from this database which is managed by JFrog.
- Index resources: Recursively go through the dependencies and analyze the resources.
- Scan the artifacts: Based on what is set for indexing.
- Create Policy: A policy in Xray defines license and security compliance specifications. So, a policy enables to creation of a set of rules that contains license/security-related criteria and its corresponding set of actions to be triggered, e.g. it can block the download of the component. Policies are enforced when they are applied to watches, which is described below.
- Create Watch: Select the resources you would like to scan for security vulnerabilities and compliance and then determine what actions to take if a security vulnerability is detected.
- Impact Analysis: This is ongoing and if a new vulnerability or license is added to the database, Xray will identify the impacted artifacts immediately.
Policy and Watches enforce certain governance standards for compliance on the binaries, which we will see in the next sections.
Index the Resources
Xray allows you to manually select the repositories to be analyzed for indexing.
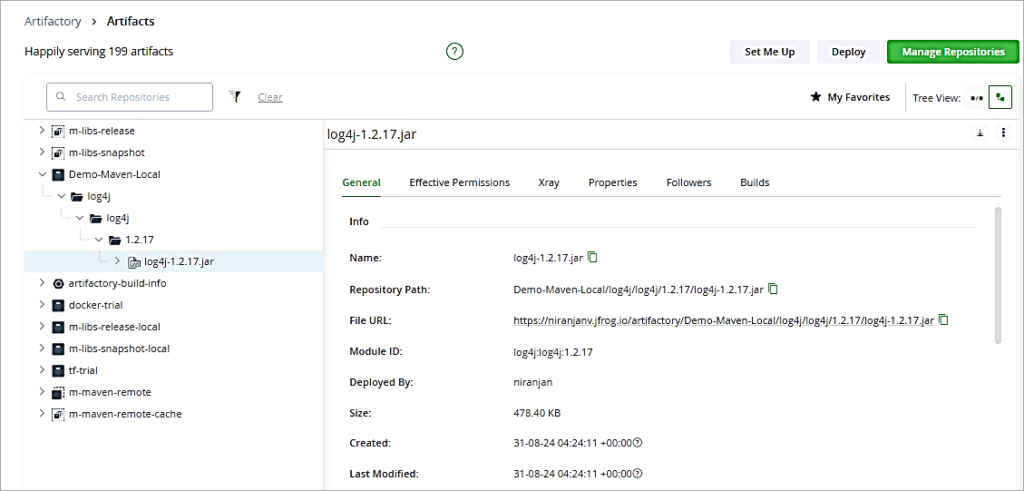
Sample Maven WAR file to be scanned. In JFrog Artifactory, I have a local repository with a JAR file to be scanned for vulnerabilities. Let’s look at the above steps to scan the artifacts.
Recommended Reading =>> JFrog Artifactory Tutorial
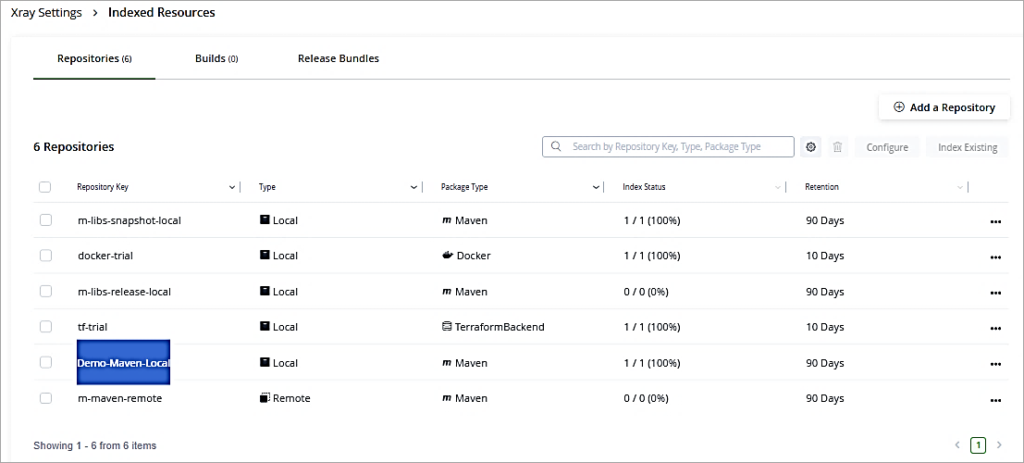
To first start indexing the resources, go to the Administration Tab -> Xray Settings -> Indexed Resources. Click on Add a Repository to add the local repository which has the WAR file to be scanned. Look at the Index status column which will show it as 100%.
Create Policies / Watches & View Scan Result
Create Policy
In JFrog Artifactory go to the Application tab -> Xray -> Watches & Policies. Click on New Policy.
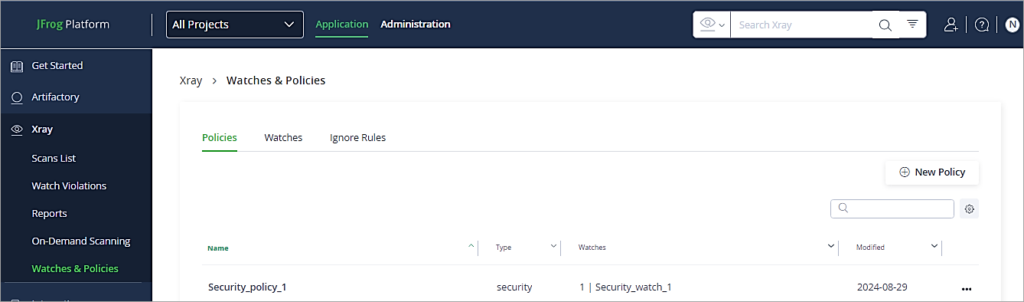
Follow the instructions step by step as shown below in the Policies Tab. Provide a name to the policy.
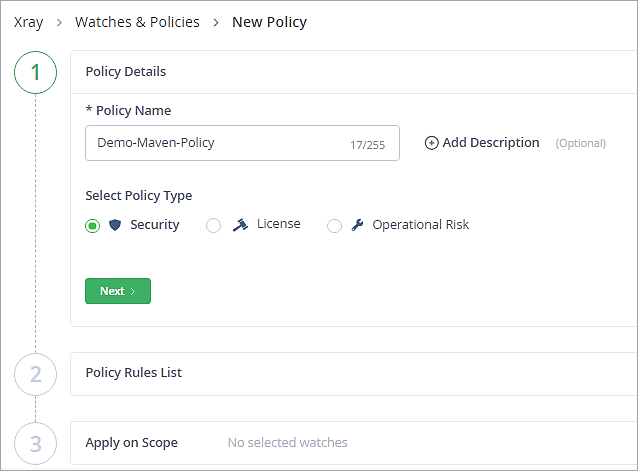
Click on Next.
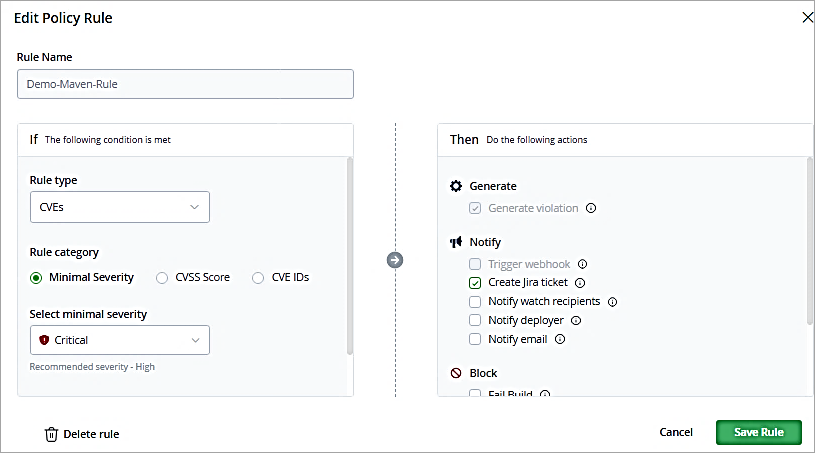
Add a rule name and select as shown to block the downloads with critical severity of CVEs identified. Save the rule.
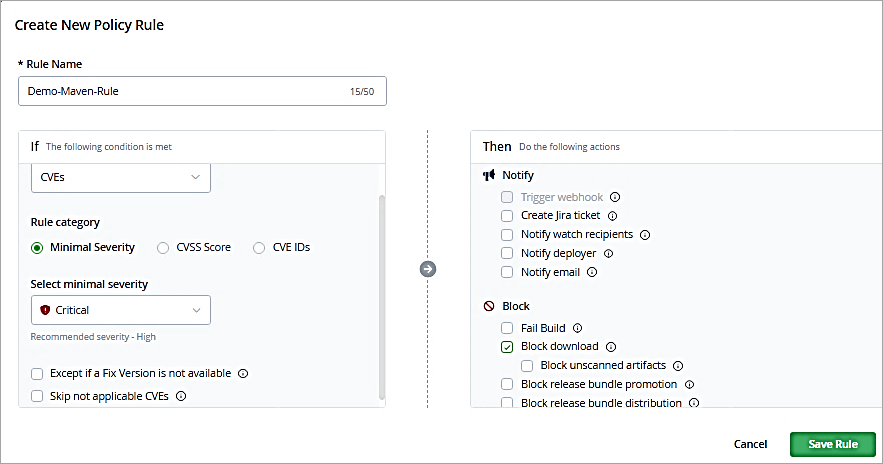
Click on Next.
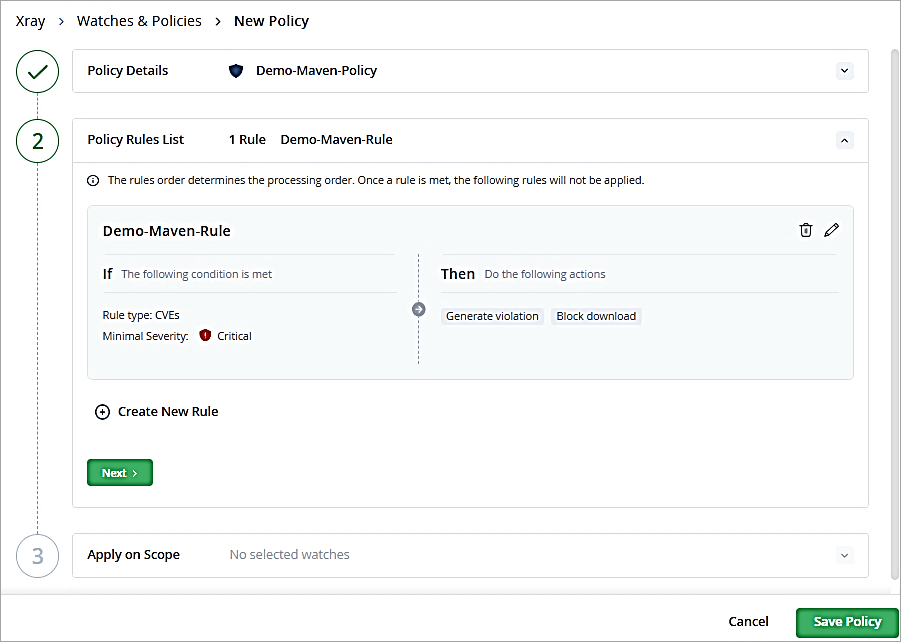
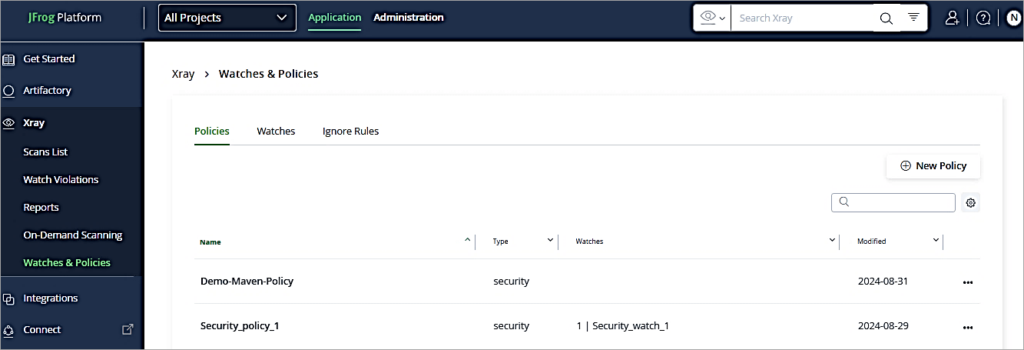
In the Apply on Scope section, we do not have a Watch yet created, so click on Save Policy. The policy is listed.
Create Watch
Go to the Watches tab and click on New Watch.
Provide a name to the watch and Add repository to be scanned.
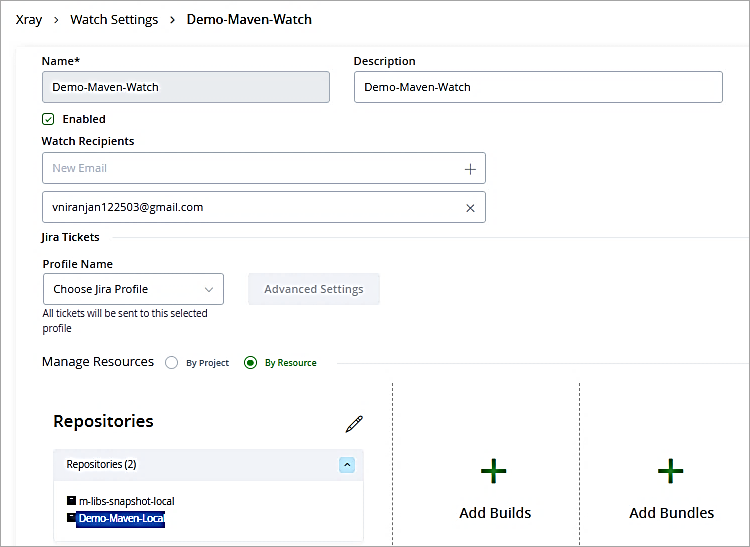
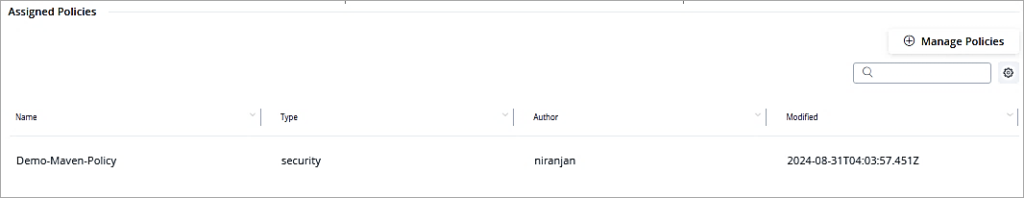
Under Assigned Policies add the policy just created.
Click on Create.
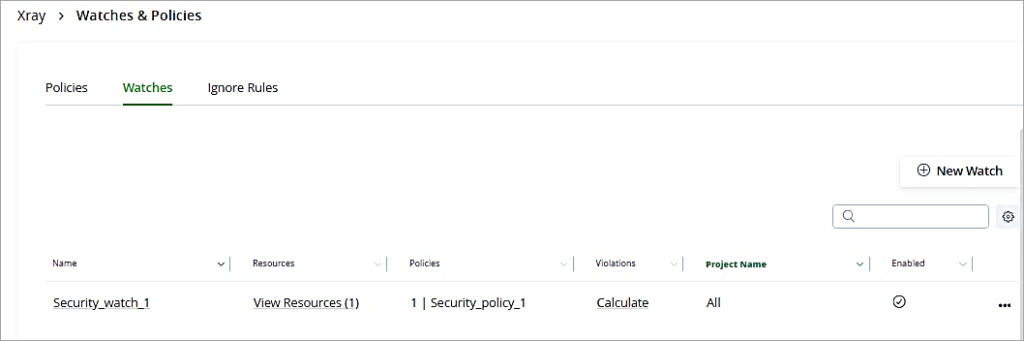
The Watch just created is listed.
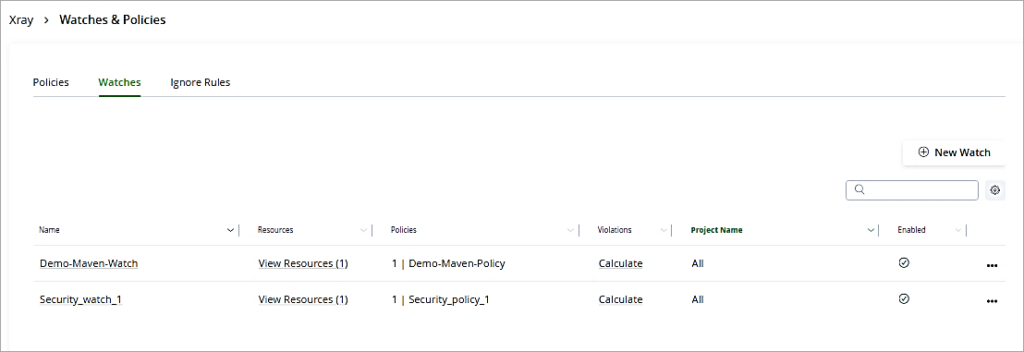
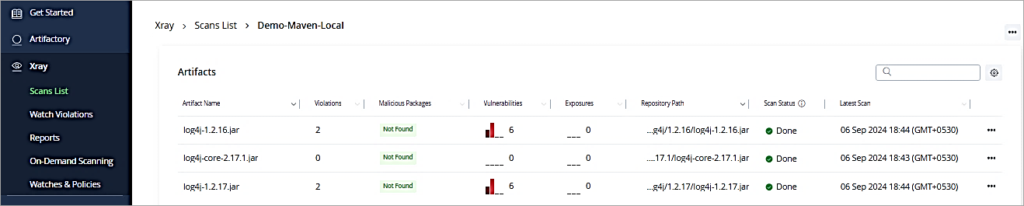
Post the creation of Policy and Watches, the JFrog Xray scan results for the security issues for the repository are available in the Xray scans list.
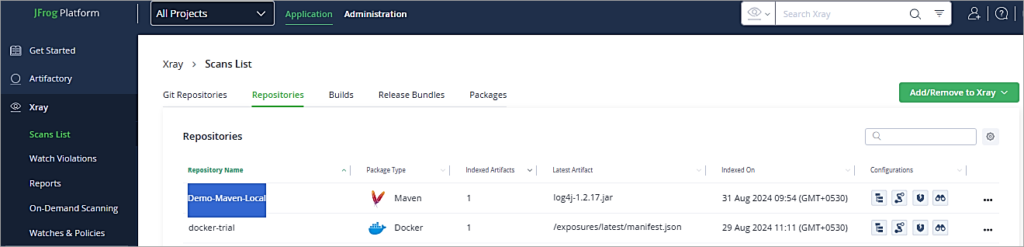
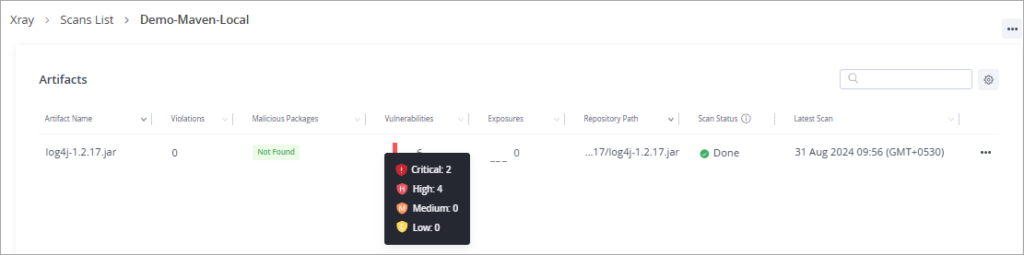
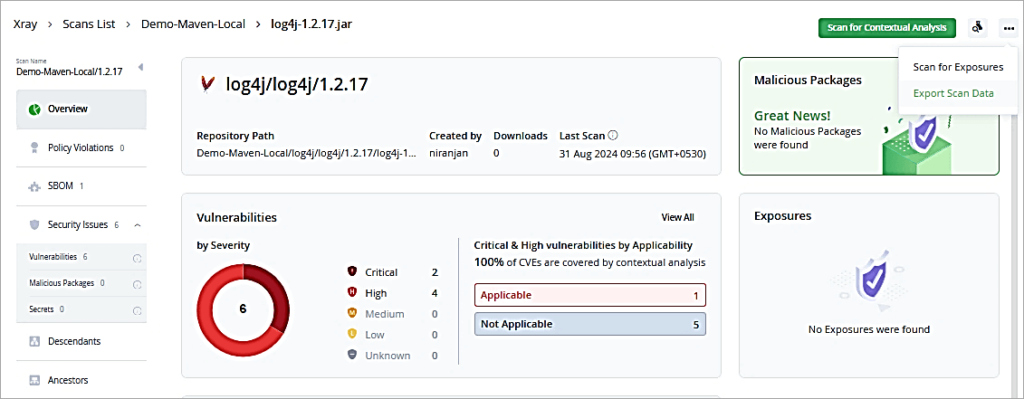
To view the scan result, go to the Application Tab -> Xray-> Scans List. Click on the repository.
Click on the Vulnerabilities to view all the severity types of vulnerabilities.
The overview page is displayed.
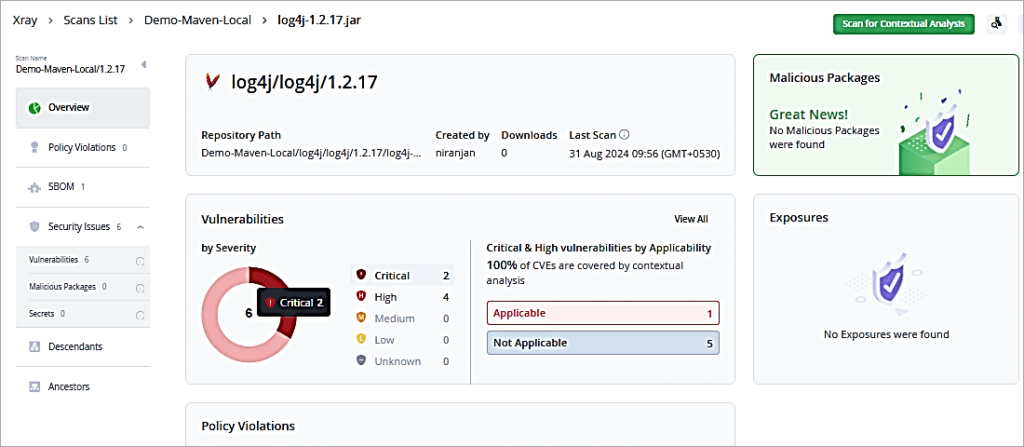
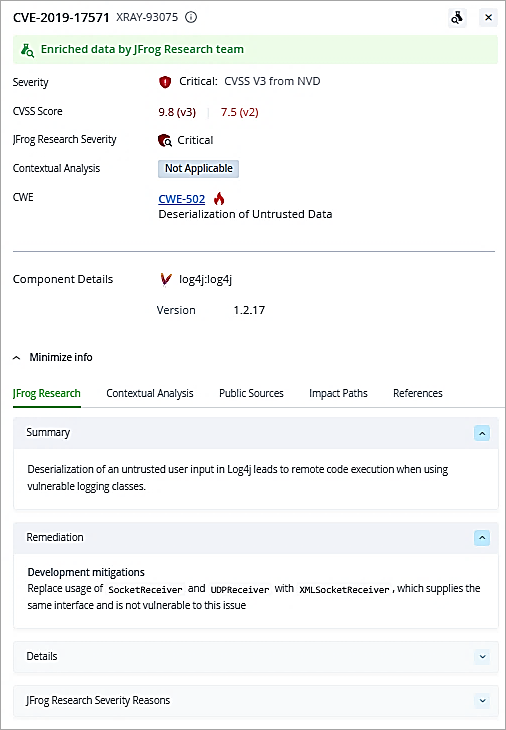
Click on the Critical Pie to drill down further.
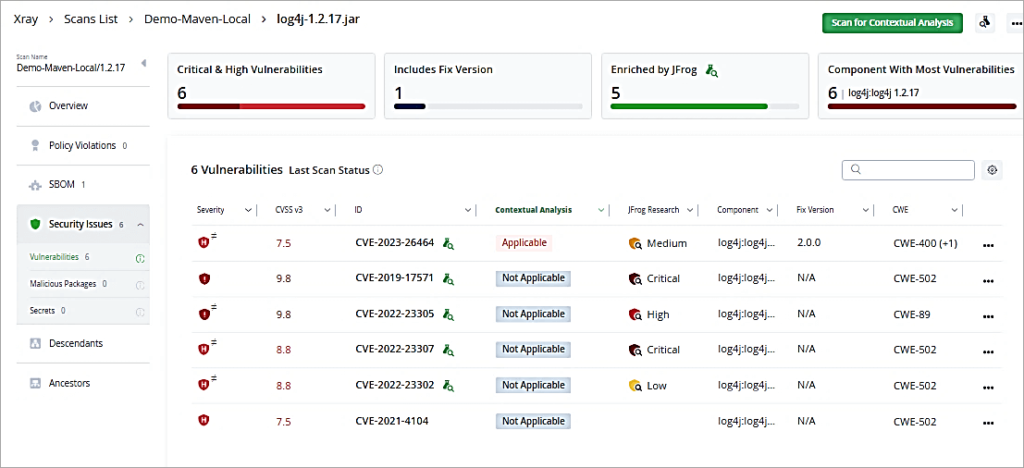
Click on one of the Critical CVE. You can then look at the issue and remediation as well.
Back in the main overview screen, you can also export the scan data to PDF, CSV, or JSON format. The option is available on the right side.
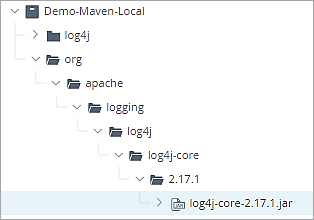
Now I have added a new version of log4j 2.17.1 to the local repository to be scanned.
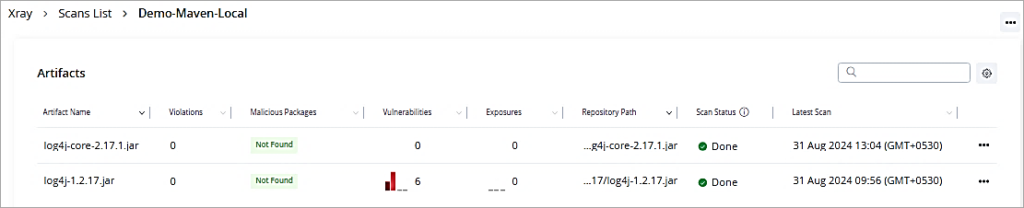
Let’s look at the scan list for the artifact. It is free of vulnerabilities and can be used further in development.
Integration of JFrog Xray With Atlassian Jira
JFrog Xray has a built-in integration with Atlassian Jira. The integration enables the automated creation of tickets (e.g. create a bug) in Jira based on the results of security scans. As security or license vulnerability, violations are found a new ticket in Jira is created which enables developers/teams to prioritize the same and resolve it.
Getting these security notifications in Jira makes it easy for developers/teams to track them alongside other bugs.
Also Read =>> Complete JIRA Tutorial
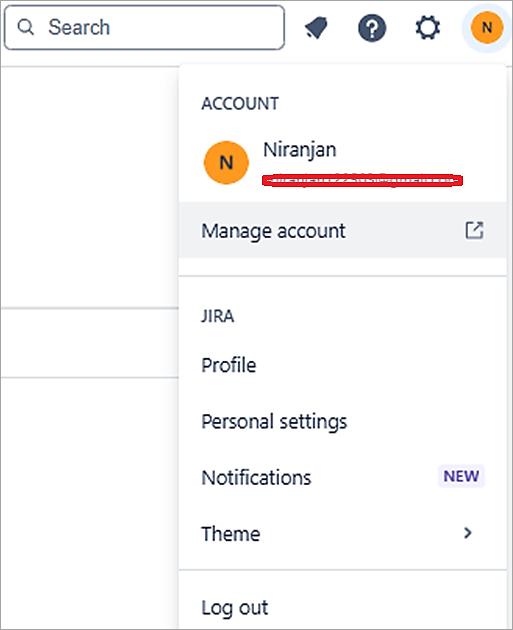
To perform a basic authentication in Jira, we can use API Token with Jira loud. To generate an API Token, in Jira cloud click on Manage Account in your profile.
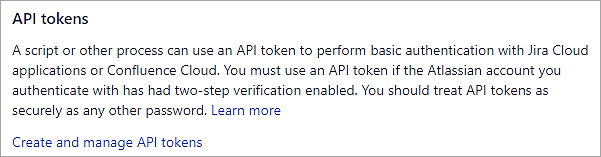
Go to the Security TAB and click on the link Create and manage API tokens
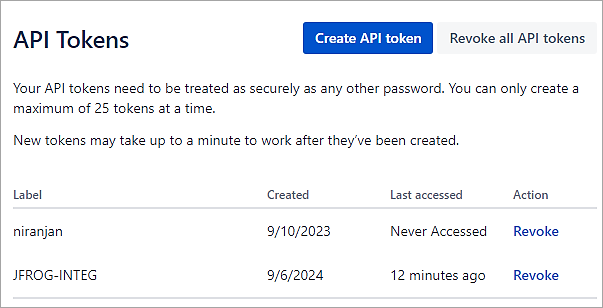
Click on the button Create API token and provide a label. Copy the token for further use with the integration with JFrog Xray.
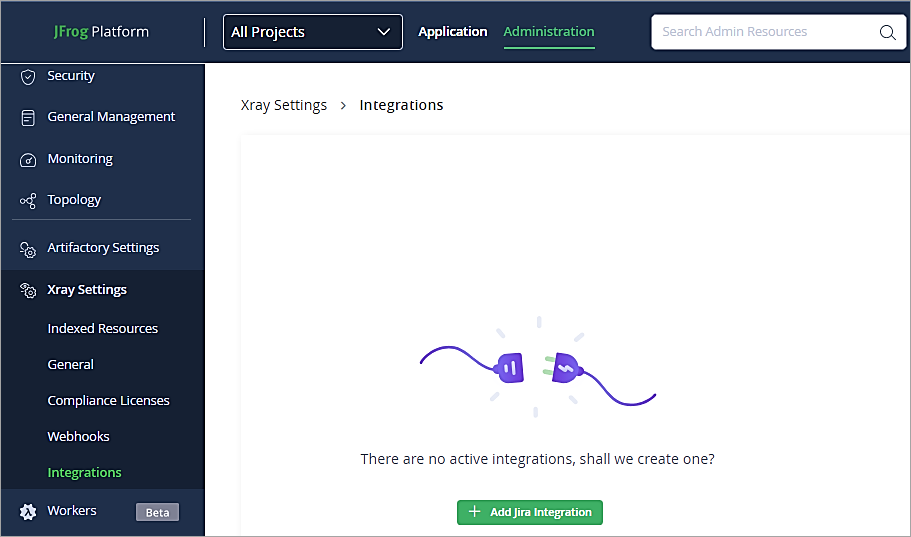
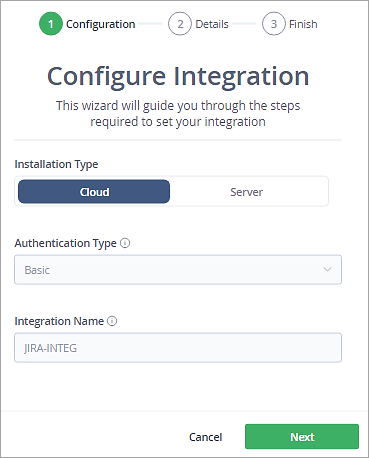
Back in JFrog Artifactory UI to set up the integration go to Administration Tab -> Xray Settings -> Integration. Click on Add Jira Integration.
Select Basic Authentication Type and click on Next.
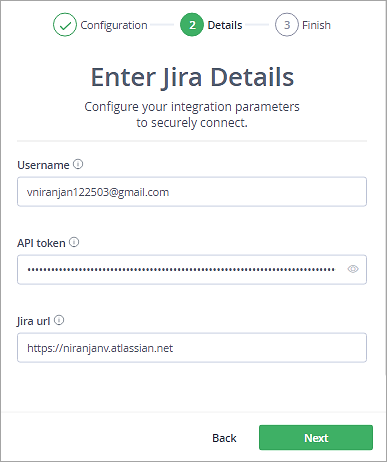
Enter the Jira Cloud username and API Token and click on Next.
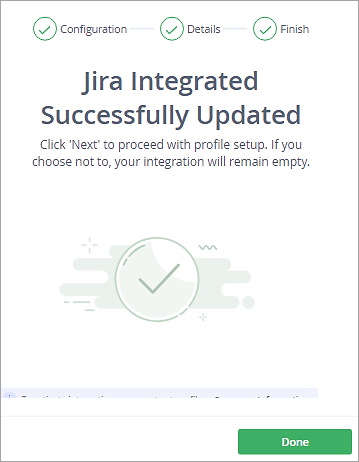
You should now see a successful message. Click on Done.
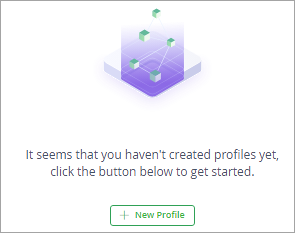
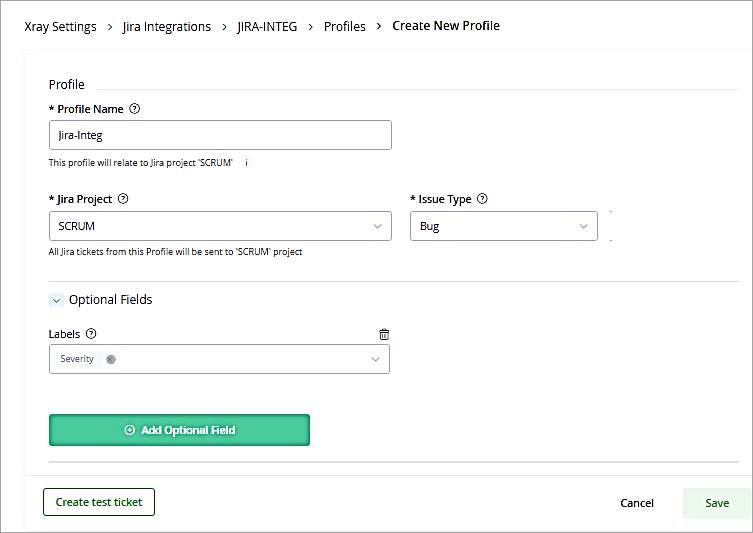
Click on the integration and click on New Profile to select the Jira Project.
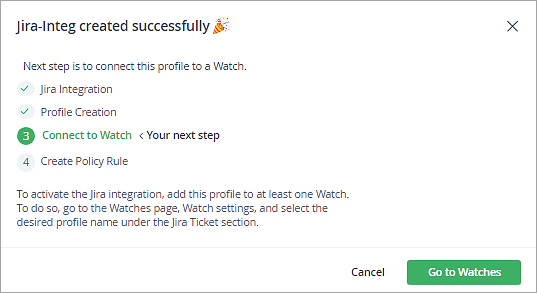
Provide Profile Name, select Jira Project and Issue type. Click on Save.
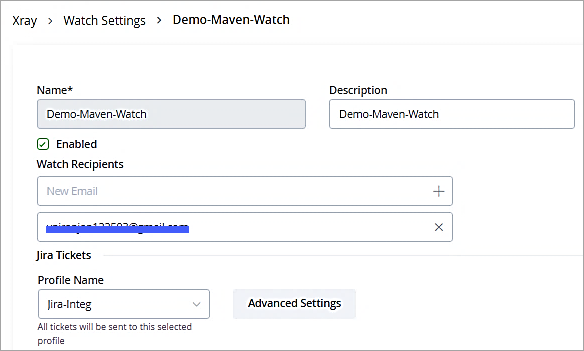
The next step is to select the Jira integration profile for the existing watch. Click on Go to watches.
Select the profile and click on Save.
Lastly, enable the checkbox to create Jira tickets on violations in the policy.
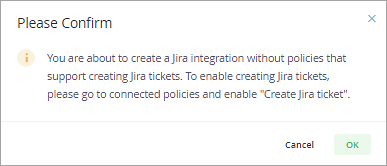
In the policy created enables the check box. Click on Save Rule.
As you scan the artifacts from the Scan List.
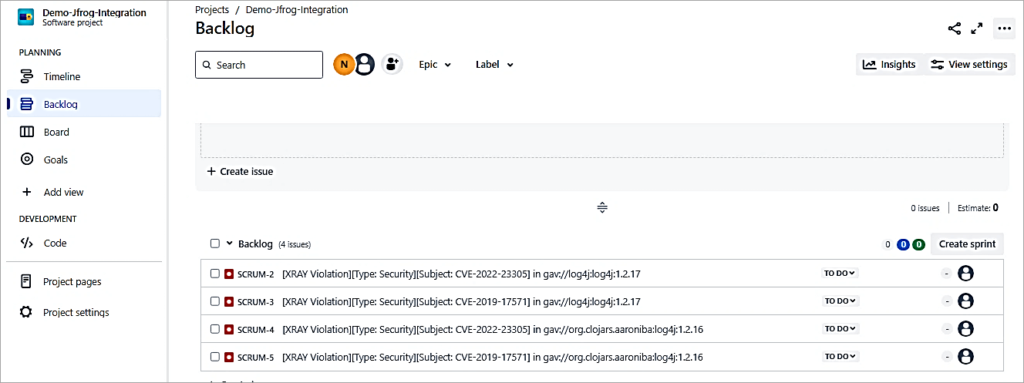
The bugs are created in Jira, which can then be assigned to the developers to resolve them the same. As you can see from the above screen, there are a total of 4 violations detected. There are 4 bugs created in Jira.
Using JFrog Xray With Jenkins
The artifacts built should be deployed to production systems without any vulnerability. So, in a Jenkins pipeline after the artifact (e.g. WAR file) is available JFrog Xray should scan the same and upload it to JFrog Artifactory local repository if no vulnerabilities are found else the BUILD should FAIL as defined in the Xray Policy.
Pre-requisites: Install JF CLI from the URL Get CLI | JFrog and configure with the JFrog Artifactory/Xray URLs using the command ‘jf config add’
Also Read => Guide to Setup & Configure Jenkins with Selenium
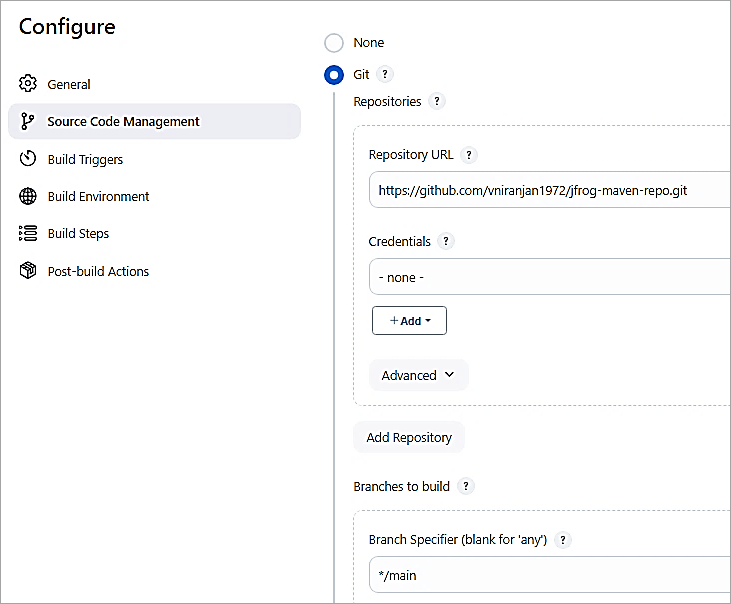
Here are the steps in a Jenkins pipeline starting with SCM checkout.
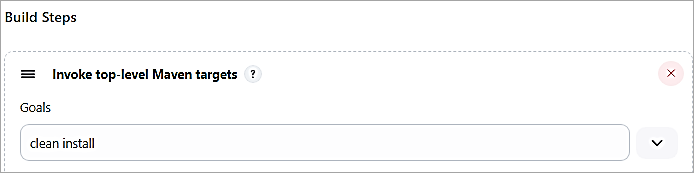
Add a Maven Build step to build the WAR file.
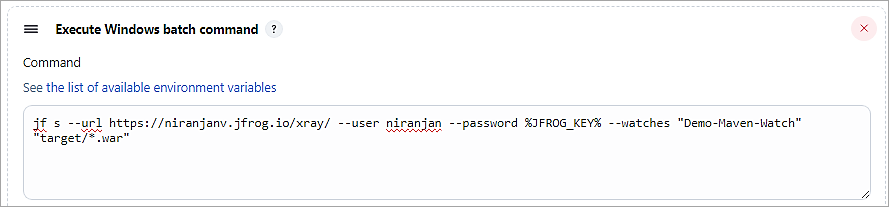
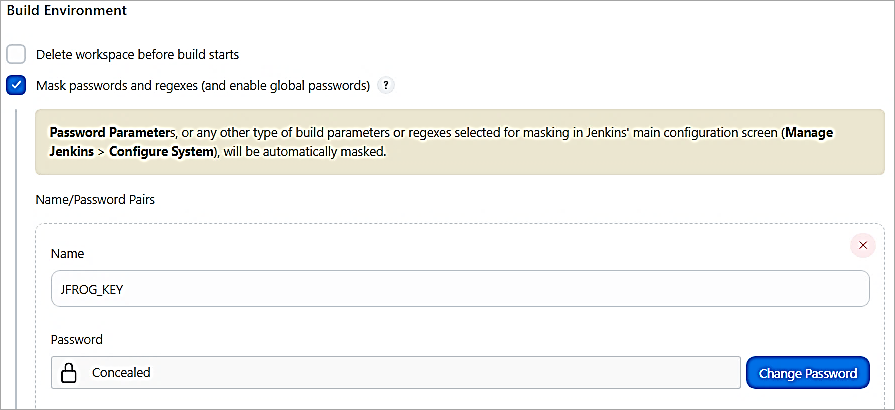
Add another build step to run the X-ray scan using JF CLI. For the password, I have used the Identity token created from Artifactory and used the Mask Password plugin to conceal the password. The watch created is also passed as a parameter to the JF CLI command. JF SCAN(S) command is to scan the binary.
Mask Password
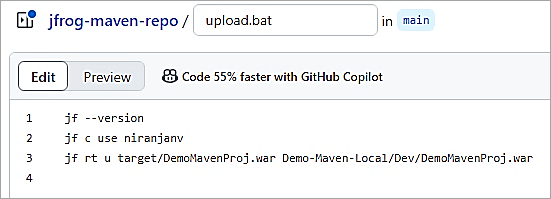
Add a Post-build Action task to run a batch file to upload the artifact if the BUILD was SUCCESS.
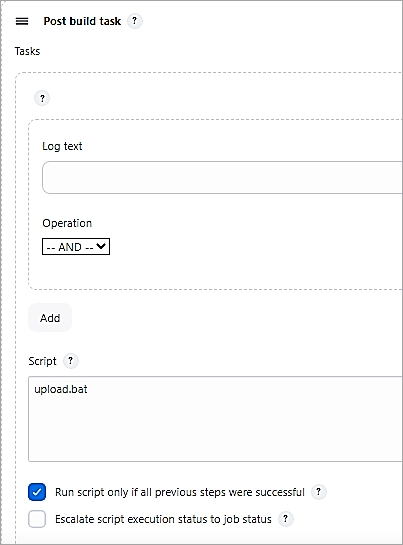
The batch file upload.bat committed in the GitHub repository has the following commands to upload the WAR file to Artifactory local repository by first setting the active server by its ID using the command jf c use <ID>. The ID is configured with the help of jf c add command.
Save the Jenkins job and trigger the build. As the scan showed no vulnerabilities, the artifact was uploaded to the Artifactory local repository otherwise, if violations were found the build itself would fail and not proceed further with upload to the Artifactory local repository.
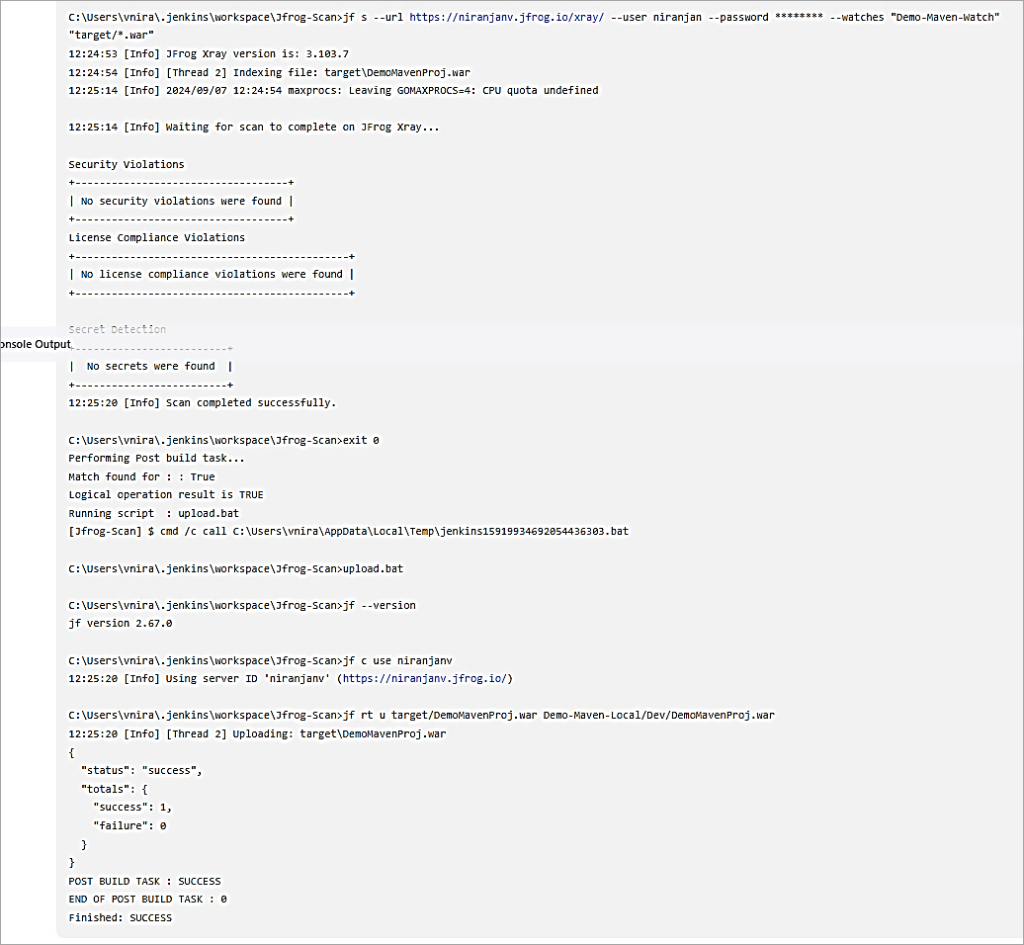
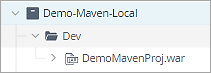
Artifact uploaded to the Artifactory local repository.
Software Composition Analysis Using JFrog Extension in VS Code IDE
Software Composition Analysis (SCA) helps to scan project dependencies to find security issues which in turn will provide you with the CVE data which is provided by the JFrog security research team. The Common Vulnerability Exposures (CVE) is a catalog of information security vulnerabilities that is more like a dictionary and not exactly a CVE database.
In this section, we will look at how to scan a Node project dependency for vulnerabilities using the JFrog extension within VS Code IDE.
Suggested Read =>> Visual Studio Code vs Atom comparison
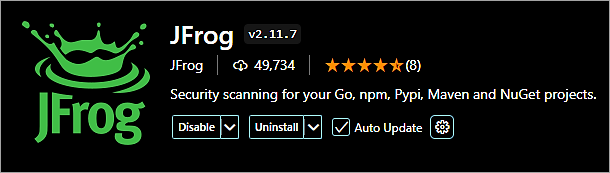
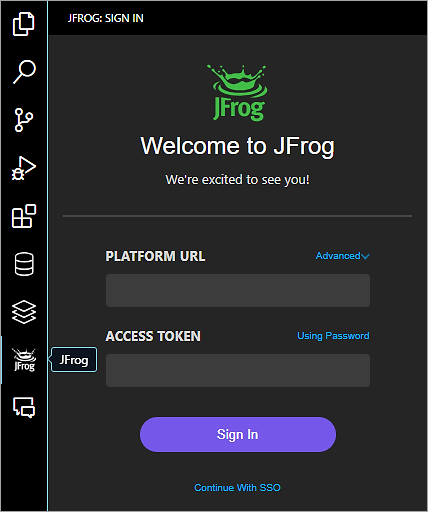
To begin with, install the JFrog extension in VS Code IDE and connect to your JFrog Artifactory SAAS instance.
Once the extension is installed, click on the JFrog tab and add the Platform URL and Access Token to sign in.
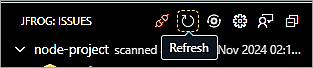
Click on the Refresh button to scan the Node project in the JFrog tab.
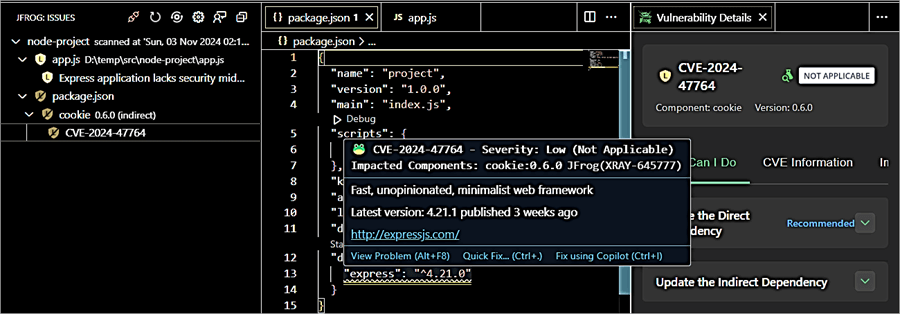
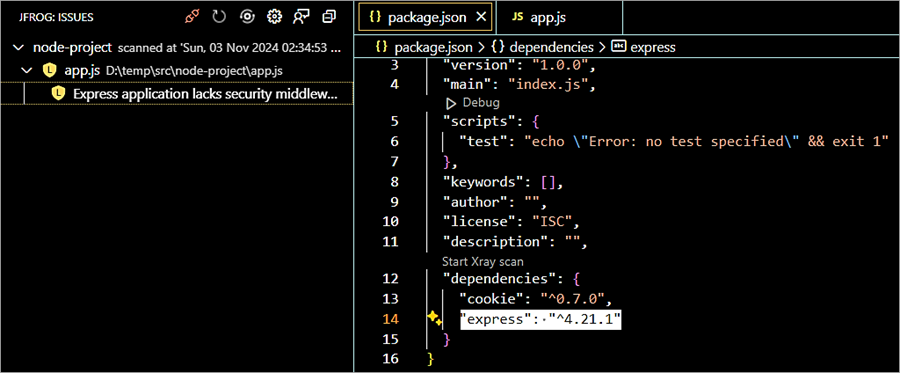
Once the node project is scanned you can see that there is an issue with the express module version, though the severity mentioned is low and the suggestion is to use the latest version of the express module.
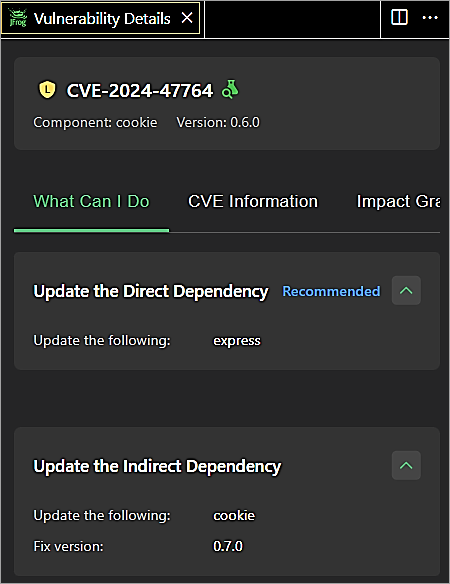
Update the dependency version of the Express module to 4.21.1 in package.json file, install the module, install the indirect dependency of cookie version 0.7.0, and rescan the project.
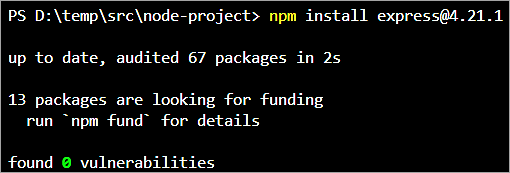
Install the latest version as specified using the command ‘npm install express@4.21.1’
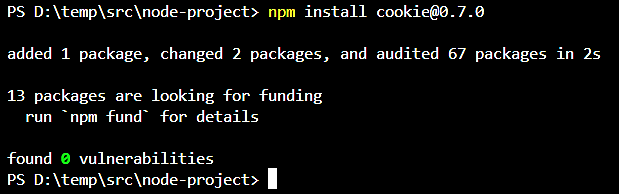
npm install cookie@0.7.0
Rescan the project. No further CVE-related data is shown and no vulnerabilities.
FAQ’s on JFrog Xray
1. What is JFrog Xray?
JFrog Xray is to perform on-demand scanning to identify vulnerabilities in the artifacts
2. What is the difference between JFrog Xray and npm audit?
Npm audit is an open-source utility that scans and generates reports of known vulnerabilities within a NPM package only whereas JFrog Xray can scan for packages within JFrog Artifactory repositories.
3. Does JFrog Xray scan for malware?
No, JFrog Xray does not scan for malware
4. Does JFrog Xray scan source code?
The JFrog Xray VS Code extension scans the project code dependencies for any security issues and provides CVE data. The extension supports the GO, Maven, npm, yarn, pip, NuGet package managers. For more information, visit the URL https://docs.jfrog-applications.jfrog.io/jfrog-applications/ide/visual-studio-code
5. Is JFrog Xray Open Source?
No, it is not open source
Conclusion
To summarize, it is very important to secure your software from any kind of threats. So JFrog Xray scans and identify vulnerabilities in your binaries so that appropriate remediations can be done before deploying the software to production systems.
To add on, the vulnerabilities reported can be logged into Atlassian Jira as bugs or any other appropriate type based on the type of vulnerabilities for the attention of developers to resolve the same, which is definitely a good practice.
Thank you and happy reading.
Was this helpful?
Recommended Reading
-

Quickly understand the simple process of how to create local, remote, and virtual repositories with NPM package type and integration of Artifactory with Jenkins through step-by-step screenshots: In the previous tutorial, we saw how to use the generic and docker package type. At the last part, we will look at…
-

A step-by-step guide of PHP Composer, Gems, and NuGet package types in JFrog Artifactory. Get to understand the installation and configuration process of Composer packages with examples: In this tutorial, we will look at using the JFrog Artifactory PHP Composer, Gems, and NuGet package type. In the first part of…
-
Are you a developer who wants to understand the Setup of RPM and Debian repositories with JFrog Artifactory? Here is a perfect guide to answer your queries through step-by-step demonstrations: In the previous articles on this JFrog Artifactory series, we have seen the usage of different package types that developers…
-
This tutorial on Gradle and GO Package Type will explain how to create local, remote, and virtual repositories along with the configuration of GO Repo with pictorial examples: In our earlier tutorials of this JFrog Artifactory article series, we did see how to use the generic, python, and docker package…
-
Learn Jira Admin Aspects: JIRA Administration and User Management Tutorial We learned about the JIRA workflow in detail in our previous tutorial. We are going to learn all about the JIRA Administration today. This is a unique opportunity to learn the admin aspects of a Project/Incident/Test Management tool. Not all…
-
This JFrog tutorial will deeply educate you on how to create local, remote, and virtual repositories for Generic, Python, and Docker Package types with easy examples for your quick understanding: In the previous tutorials of the JFrog Artifactory series, we learned about the different types of repositories, Property sets, and…
-
Deeply understand how to manage the most commonly used General Administration Activities in JFrog Artifactory. Analyze how these activities are performed by the project admin: In this article, we will look at administering certain critical activities as part of your JFrog Artifactory Administration needs. This tutorial will cover topics like…
-
This introductory tutorial will explain everything that you need to know about JFrog Artifactory. Discover more about Maven Package Type and its usage with simple examples: As a project team, you need a repository to store your Build Artifacts and their versions. JFrog Artifactory is the repository manager that helps…