A hands-on review of the StormForge platform for performance testing and optimization of Kubernetes applications prior to deployment:
With the transformation from monolithic to microservice-based applications running in containers on Kubernetes, applications have become more complex and dynamic. And while some believe that moving to the cloud mitigates the need for performance testing and optimization, the opposite is true.
In this tutorial, we will see how to use the StormForge platform to optimize Kubernetes applications for performance and cost.

Table of Contents:
Understanding the StormForge Platform
While the AWS, Azure, and Google Cloud platforms will all scale up and down with usage, these cloud platforms only operate and scale resources, which differs from scaling an application. Your cloud platform won’t automatically make your system fast, stable, or efficient.
Performance testing and optimization are crucial to understanding your system and architectural design and to ensure your application runs as efficiently and cost-effectively as possible.
There are two key elements to consider for optimizing your Kubernetes applications: Performance and Cost-efficiency.
Performance: A proactive approach is required to effectively manage the performance of your cloud-native apps. Reactive, monitor-and-alert approaches to performance management are not enough on their own, for two reasons.
First, by the time you detect a problem, user and business results have already been impacted. Second, with the complexity of modern application architectures, problems can be very difficult to track down and solve, pushing MTTR beyond acceptable levels. It’s far better to ensure performance problems don’t happen in the first place.
Cost-efficiency is another key consideration for cloud-native applications. Configuring a container for deployment requires the developer to specify important settings like CPU requests and limits, memory requests and limits, and the number of replicas to run. Additionally, there are application-specific settings.
For a Java app, that might include things like JVM heap size and garbage collection settings.
Each of these settings impacts the cost of running your application in the cloud. Multiply this by the number of containers you are running and the number of combinations becomes essentially infinite.
In an effort to ensure performance, most companies start out by over-provisioning, in other words allocating more resources than are needed to run the application. While this may be a viable solution early in the ramp-up phase, it quickly becomes costly as app usage scales up in production.
A systematic approach to performance testing and optimization with the right tools can help organizations strike the right balance between performance and cost-efficiency, ensuring applications perform well for end-users without overpaying for cloud resources.
Following is a hands-on review of application performance testing and optimization using the StormForge platform.
StormForge Platform Components
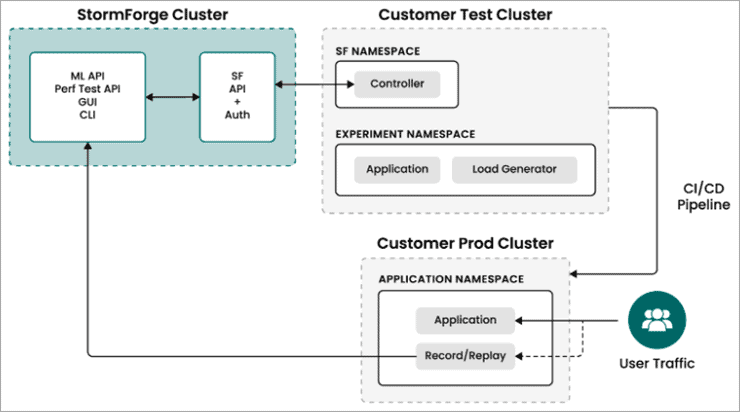
StormForge platform brings together performance testing and automated resource tuning to ensure Kubernetes application performance at the lowest possible cost. The StormForge platform consists of three main components – Performance Testing, Optimization, and Record/Replay.
Performance Testing
StormForge Performance Testing is a cloud-based solution that allows users to quickly create load tests and scale from tens to hundreds of thousands of requests per second, and even millions of concurrent users. It uses an open workload model, meaning that agents generating load are independent of one another.
This provides a more realistic testing scenario compared to a closed workload model, where the system being tested has an impact on the test itself.
Application Optimization
Performance testing will tell you how your application will perform under load, but it won’t tell you how to address issues. StormForge Optimization uses machine learning to understand your application in its own environment and, through a process of rapid experimentation, find the configuration that will best meet your goals for performance and cost-efficiency.
The recommended configuration can be automatically promoted to production.
Record/Replay
Accurate load generation can be a challenge for effective performance testing. StormForge Record/Replay addresses this challenge by recording actual production traffic for your application and then feeding that into Performance Testing to provide a starting point for load tests that match reality instead of just an educated guess.
Record/Replay operates as a sidecar that you can install in production to mirror user traffic that comes into your production cluster.
StormForge Platform Architecture

Performance Testing with StormForge
The main testing approach with StormForge is to model clients (or users) that will arrive at your system at a given time. Each client that arrives will perform one session and then leave again–just like in real life.
Anatomy of a Test
Tests consist of one test case, which describes the test setup and parameters, and test runs, which represent test executions of a test case. This ensures that you can link every test execution to a specific test configuration.
A test case has at least one target which is under test and at least one arrival phase which determines the load progression during your test run. Each client that is launched will pick one session to execute, where a session consists of a declarative description of which steps to perform.
Types of Performance Tests
StormForge Performance Testing can execute several types of performance tests, including:
- Load Testing: This is the simplest form of performance testing, where you induce a normal or expected workload to a system under test and observe it. You can use load tests to determine general system behavior, latency, and throughput. In general, load tests are used to verify your quality criteria.
- Stress Testing: It is basically a load test, but we are applying a higher-than-expected workload to see how the system behaves under serious stress and when exceeding design limits.
- Scalability Testing: It helps you understand how effectively your app can grow. By using stress tests in a series where you steadily increase the system’s resources, you can easily tell if your system can translate this into additional capacity.
- Spike Testing: This can be used to determine how well your system can cope with sudden traffic spikes. It is comparable to a load or stress test, but modeled as a sudden burst of traffic.
- Soak Testing: It is again basically a load test where you hold the load over longer periods of time to look for long-term effects, like memory leaks, disk space filling up, etc.
- Configuration Testing: It looks at the change in performance if the application configuration is modified. Configuration can be almost anything here: your environment, services that you are using, dependencies of your software, etc.
Creating and Running Tests
To define performance tests with StormForge, you use an easy-to-understand JavaScript DSL. Below is an example of a stress test where four arrival phases are defined, each with a duration of 5 minutes. The load increases at a ratio of 100% in each step.
StormForge uses an easy-to-understand JavaScript DSL to create tests:

Debugging of test cases can be done using Session Validation Mode, which allows you to ignore the defined arrival phases and run a single user for each defined session. This allows validation that the defined session flow works as expected.
Running a test case is then done with a simple command, or you can create a performance test as code and build it into your CI/CD workflow to run automatically as part of your release process.
Test Results
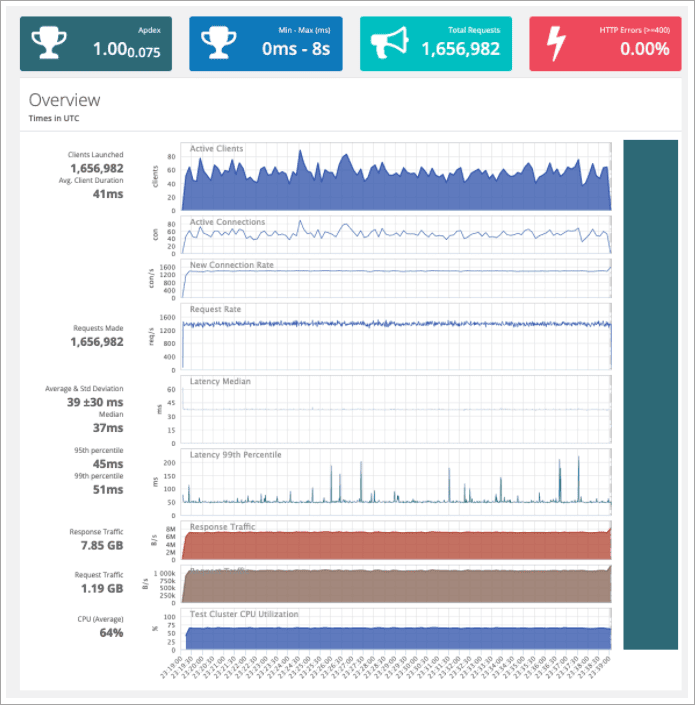
After a test run completes, StormForge provides a detailed report showing Apdex score, min and max response times, HTTP errors, and much more. Users can drill into reports to understand the results of performance tests at a granular level.
The below Performance Testing Reports show detailed results:

Application Optimization
While StormForge Performance Testing will tell you how your system will perform, Optimization is used to make it perform better, at a lower cost.
Key Concepts
To optimize an application, StormForge runs what is called an Experiment. An experiment is the basic unit of organization in StormForge Optimize. The purpose of an experiment is to try different configurations of an application’s parameters and measure their impact.
An experiment is composed of three primary concepts – Parameters, Trials, and Metrics.
- Parameters are the input variables to an experiment, i.e. what you want to tune in your application (for example cost, memory, or the number of replicas).
- A Trial is a single run of an experiment with values assigned to all parameters. An experiment typically consists of many trials, with the exact number specified by the user.
- A metric is the outcome of a trial. Metrics are used to measure the result of a particular set of parameters. A metric is a numeric value that an experiment attempts to minimize (like the cost in dollars) or maximize (like throughput) by adjusting the values of parameters.
Experiment Generation And Execution
A StormForge Optimize experiment file can be generated starting from a basic declarative application configuration file. The experiment generator will scan the manifests provided to produce an experiment file including the necessary patches for resources and replicas parameters, metric queries, and load test configuration. You can optionally customize your experiment file further after generating it.
Upon executing the experiment, the StormForge Rapid Experimentation Engine runs through the number of trials specified. The first trial starts with a baseline configuration that can be specified by the user.
The StormForge machine learning engine gets a better understanding of the complex parameter space with each trial and gradually homes in on the set of parameters that will result in the optimal outcome as specified by the experiment goals.
View Results
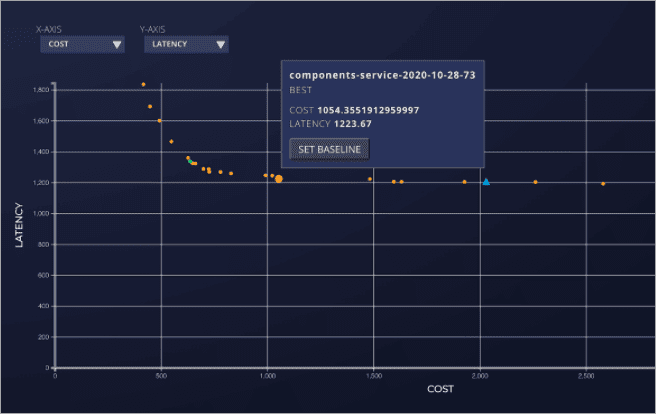
Experiment results can be reviewed as a visualization in the StormForge app. You can review the trials that have taken place and decide which parameter makes the most appropriate trade-off or use the recommended configuration. The baseline trial is displayed as a triangle on the results page, along with your experiment results.
Once you have chosen an optimized configuration, click on the point to display the parameters to use in the application manifests.
StormForge results page shows the set of parameters that will produce optimal results according to goals set by the user.

Conclusion
The StormForge platform stands out for a few primary reasons:
- It’s the only solution that combines cloud-native performance testing with machine-learning powered optimization.
- The machine learning engine’s ability to efficiently learn an application’s parameter space and find the set of parameters that will optimize for the user-specified goals.
- The ability to fully automate the testing and optimization process to be incorporated into a user’s CI/CD workflow.
Learn more about the StormForge Platform and Sign up for your free account.
If you try this performance testing and optimization tool and have any questions, feel free to share your thoughts in the comments section below!


