Can manual performance testing be conducted like functional tests? We will look into this aspect of the performance testing in this article.
In the Informative Performance Testing Series, we have explored all about Mobile App Performance Testing in detail.
A speedy and responsive site is directly correlated with higher levels of visitors and a better user experience.
Performance testing plays a vital role as it is the only way to determine the behavior of an application at different levels of load and users.
=> Click Here For Complete Performance Testing Tutorials Series
Table of Contents:
Manual Performance Testing
Delivering a quality product on time with complete Test coverage for the requirements is essential for any application.
Manual and Automation Testing have always existed as two parallel modes to help testers achieve this functional testing goal. However, manual test execution is time-consuming, expensive and is prone to errors. Automation testing is very useful in addressing these basic challenges and helps in saving time and effort over time.
A few major advantages of Automation Testing:
- The same test script can be used for every execution by just making changes in test data (wherever required)
- Execution time is much less compared to manual execution
- Consistent results
- Fills gaps where Manual testing may not be apt or suitable. (Eg: Webservices)
Similarly, performance testing results are more reliable and relevant when automated test scripts are used rather than manual test cases.
- Performance testing is a means of quality assurance which involves testing software applications and understanding their performance at an expected workload or at a given point of time. Also, knowing the response time is an important parameter.
- The main focus or goal of performance testing is to determine its Speed, Scalability, and Stability.
- Speed and effectiveness can be determined by a computer, network, software program or a device through performance testing
Below is a representation of the Performance testing process:
Both Performance testing and Automated testing are indeed some forms of executing simple checks using different tools. Generally, Test Automation is usually a combination of functional testing, load testing, and performance testing.
When a functional test automation script is adjusted to not only record pass/fail results but also to note the render/record times of objects/screens, the functional test automation script then gets converted into a performance monitor.
The whole process is as follows:
- The load generator is started to test the server response time during load or during peak hours.
- Once the assumed target load is reached, the functional test automation suite starts to measure the actual time it takes to run everything through a fully rendered environment.
- This whole process will give a wonderful insight into what the end users will experience during heavy load on an application or during peak hours.
Also read => Learn load testing process using this LoadRunner series
A diagram that explains the combination of “Performance” and “test automation” can be as below:
Can performance testing be done manually
Now the question is, ”Can Performance testing be done only through automated test scripts or can it be done manually too?”.
As we read earlier, reliable results are obtained when there is a combination of performance and automation testing. However, there are also some cases when the performance of the application can be determined manually.
Let us understand this with the help of some examples:
Example1: Suppose a short performance test needs to be evaluated by a tester. This is for an AUT within the given time limit. Then, a sanity manual test can be evoked to find out the page load or response time.
Example 2: Similarly, consider a java based web application. In order to execute the performance test manually, in this case, many active sessions of the same application should be open for testing. Manually, we can determine the number of active sessions, the number of database connections open, and number of threads running. The amount of CPU time, the memory being used and a few more parameters can also be obtained.
Tivoli Performance Viewer (TPV) can be installed to monitor the parameters of interest. Usually, the test is performed by deploying the application on the server, accessing the application from various client machines and allowing multiple threads to run.
How is the Tivoli Performance viewer used to monitor the performance of any WebSphere Application Server (WAS):
WebSphere Application Server (WAS) is nothing but a software product or framework that hosts java based web applications. The results/data obtained by performance monitoring using Performance viewer for any WAS can be analyzed to find out the factors that contribute to large response times. Following which, these factors can be modified to improve performance.
The procedure that is followed to record the performance is as below:
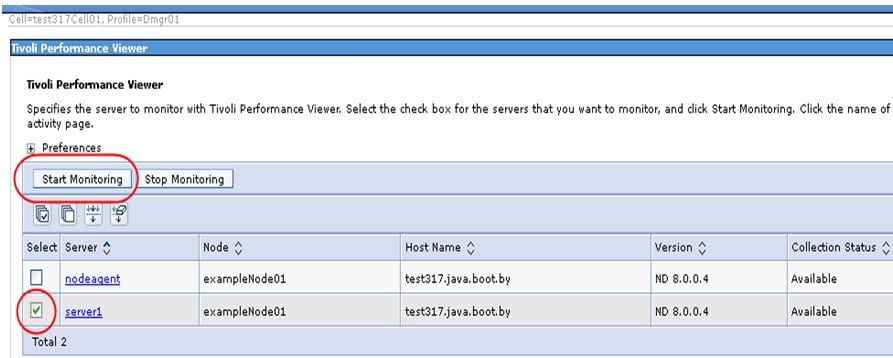
- Select the server that is to be monitored. As you can see in below diagram, Select “ server1”.
- While the application is running, server activity is monitored by viewing and examining the real-time data that is collected by Performance Monitoring Infrastructure (PMI), within the administrative console. The collected PMI data helps in attaining optimal performance.
The diagram below explains how it is done:
The check box for “Server1” is selected. On clicking “Start Monitoring”, performance viewer starts monitoring the application server’s PMI data.
(Click on the image for an enlarged view)
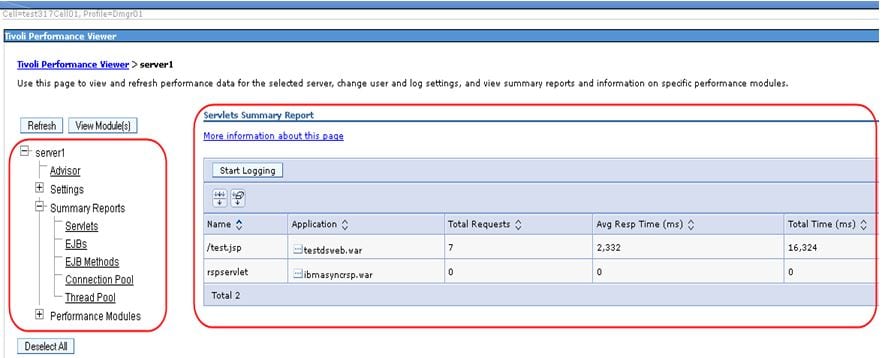
The below diagram explains the different settings and views displayed in the left panel, that are available for “Server1” under Tivoli Performance Viewer. The right panel describes the data monitored for the parameter selected in the left panel.
As can be clearly seen from the diagram, the following parameters data can be viewed and analyzed:
- Advisor
- Settings
- Summary reports (including Servlets, EJBs, EJB Methods, Connection Pool, Thread Pool)
- Performance Modules (contains the option of JVM runtime which contains graph displaying runtime PMI data)
(Click on the image for an enlarged view)
- User configuration and logging settings are done so that the server performance logs can be viewed within the administrative console. These settings also affect the application server’s performance.
- Real-time data recorded by performance viewers i.e server performance logs, etc. can be reviewed later too.
Example 3: An application’s performance needs to be evaluated for its bandwidth under different available network speeds.
Example 4: A quick preliminary database performance test can be done manually to get the necessary information.
So, in all these instances basic performance testing can be done without any automation scripts. You might need some diagnostic or monitoring tools, but 100% automation is not absolutely necessary.
When can Manual Performance Tests help
A non-performance tester can quickly perform manual tests without having to go through the process of setting up automated test suites or even without test automation knowledge.
This is very helpful when:
- Performance testers need a quick assessment of the product’s response under certain conditions.
- To execute a sanity performance test i.e. Run a few steps manually while troubleshooting the test.
What NOT to do?
A performance tester can also simulate the performance test conditions from several different client machines by reaching out to the servers individually, but that will not be a very effective way of running a performance test. So, keep in mind that not everything can be done manually.
Conclusion
Performance testing is considered one of the most technical and complex types of software testing. It requires extensive technical knowledge. Automated test scripts bring in tremendous value to the testing effort. But we should not stop exploring new ways to be combined with performance testing. Manual process testing can play a useful and important role.
Do you agree? What other variations of performance testing have you done? Post your feedback/questions in the comments section. We would love to hear from you.
Our upcoming tutorial will explain more about Website Performance Testing!
=> Visit Here For Complete Performance Testing Tutorials Series


I want to know, suppose I performed the performance testing and identify some gaps, so how we can identify that this issues related to server (deployed) or any kind of gaps related to applications that needs to take care.
Performance testing can be performed manually to limited extent and limited cases.
According to my point of view manual testing is more importing in initial stages of development.
Hi Greetings of the day. I would You Please Share performance Testing Pdf File. I added My mail ID details please Attached to This Mail..
Hi,
Thank you for sharing knowledge. but can we do manually performance testing for mobile application. there is any play store app available that only give the performance of specified of app. so that we can record the performance of that app only.
M2 monitor app that will give performance about specified and it is generating report also. my que is how to do performance testing manually? and we calculate memory and CPU utilization about only that specified app.
please tell me how to do performance testing manual
i want pdf file about software testing